50+ Sample Data Analysis Templates
-
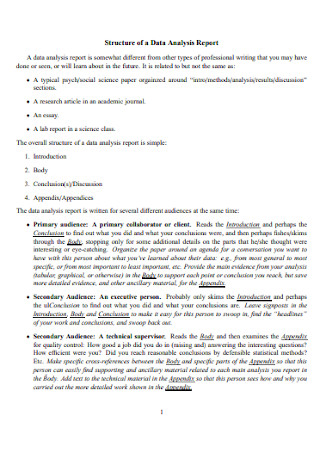
Data Analysis Report
download now -
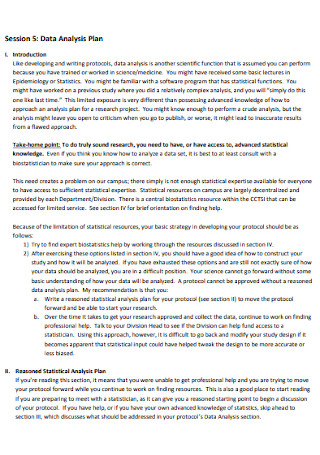
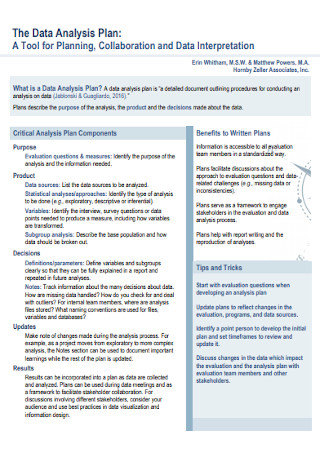
Data Analysis Plan
download now -

Office Data Analysis Template
download now -
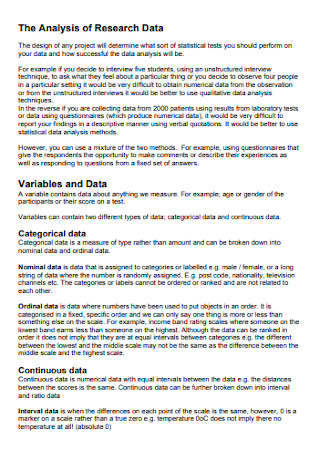
Data Research Analysis Template
download now -
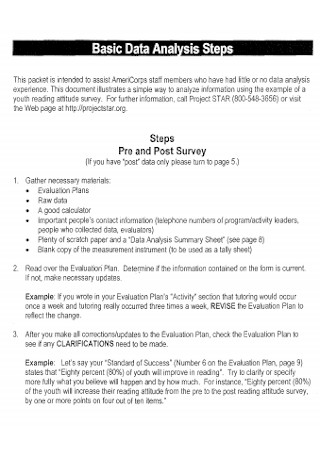
Basic Data Analysis Template
download now -
Statistics Data Analysis Template
download now -
Secondary Data Analysis Template
download now -
Data Analysis and Visualization Template
download now -
Small Data Analysis Template
download now -
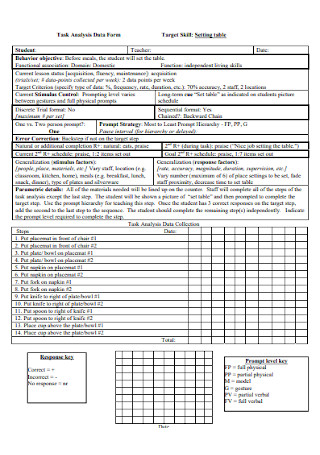
Task Analysis Data Form
download now -

Qualitative Data Analysis Report Template
download now -
Data Survey Analysis Template
download now -
Longitudinal Data Analysis
download now -
Data Management Analysis Template
download now -
Sample Data Analysis Plan Template
download now -
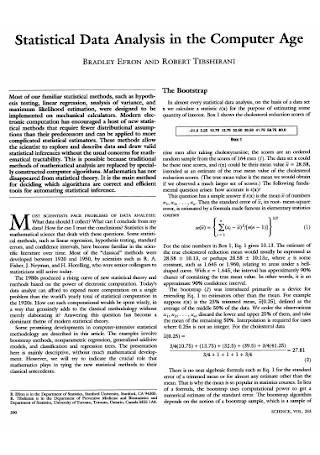
Statistical Data Analysis Template
download now -
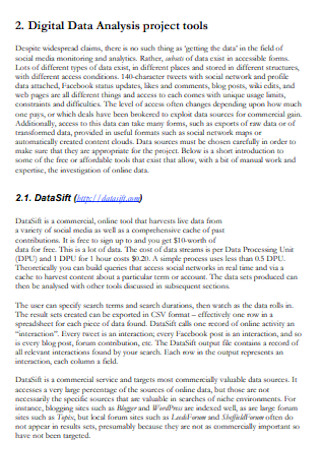
Digital Data Analysis Template
download now -
Standard Data Analysis Template
download now -
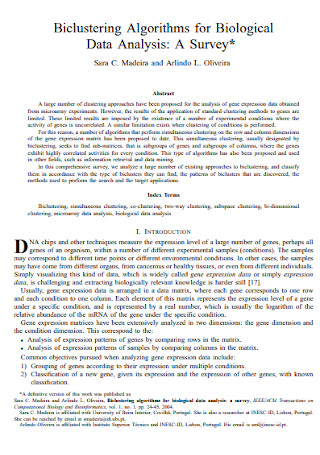
Biological Data Analysis
download now -
Simple Data Analysis Template
download now -
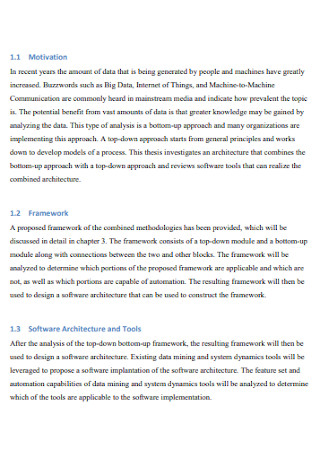
Software Data Analysis Template
download now -
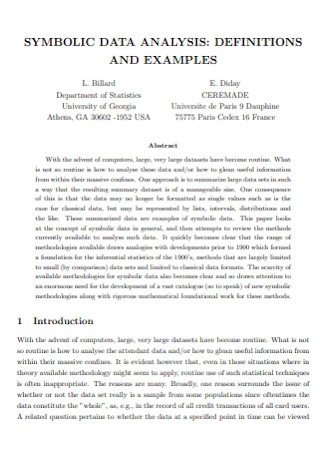
Symbolic Data Analysis Template
download now -
Areal Data Analysis Template
download now -
Optimization Algorithms for Data Analysis
download now -
Personal Data Analysis
download now -
Infinium Genotyping Data Analysis
download now -
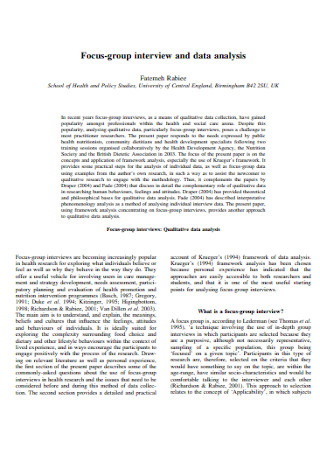
Group Interview and Data Analysis
download now -
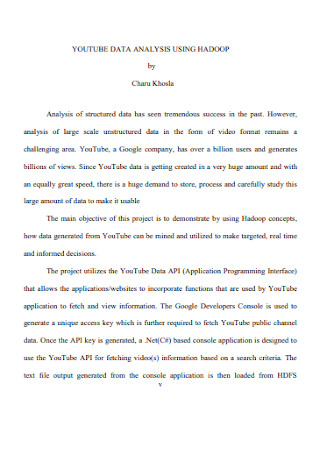
Youtube Data Analysis Template
download now -
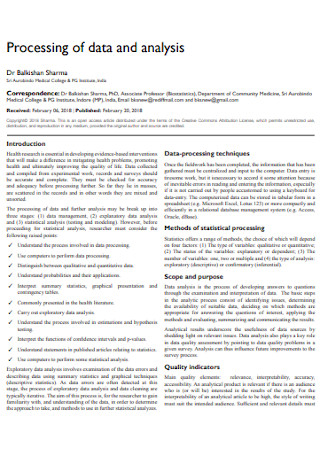
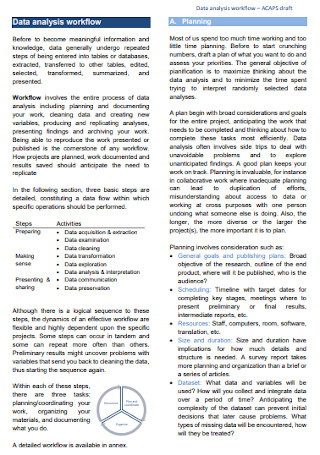
Processing of Data and Analysis Template
download now -
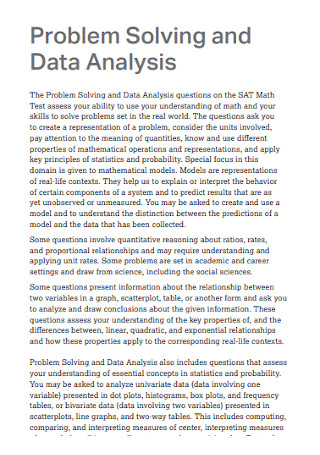
Problem Solving and Data Analysis
download now -
Formal Data Analysis Template
download now -
Modern IT Data Analysis
download now -
Exploratory Data Analysis
download now -
Online Data Analysis Template
download now -
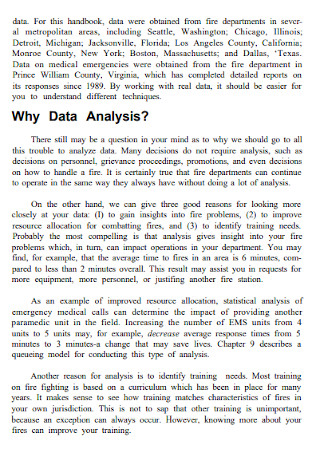
Fire Data Analysis Template
download now -
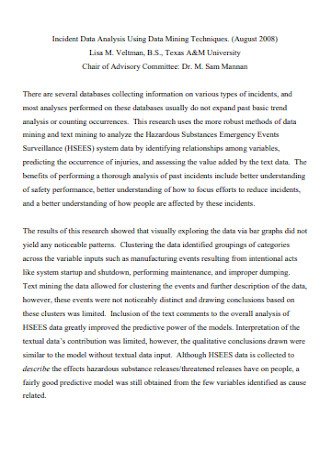
Incident Data Analysis Template
download now -
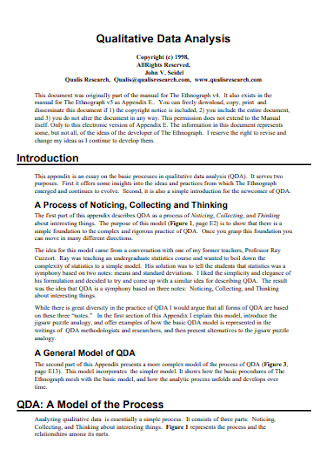
Qualitative Data Analysis Example
download now -
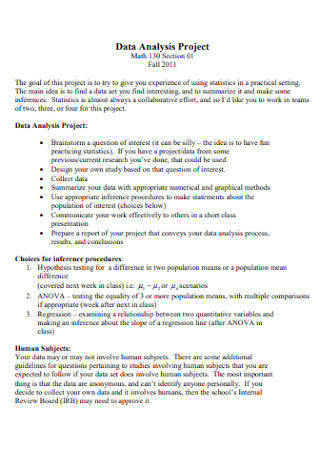
Project Data Analysis Template
download now -
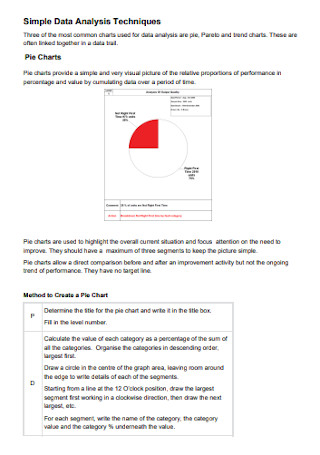
Simple Data Analysis Techniques Example
download now -
Data Analysis Format
download now -
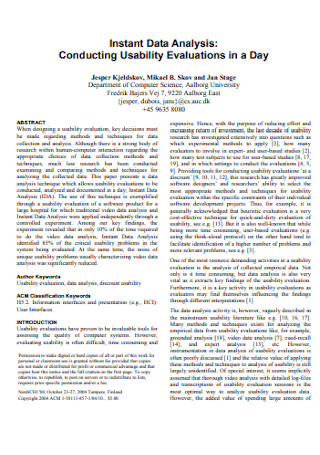
Instant Data Analysis
download now -
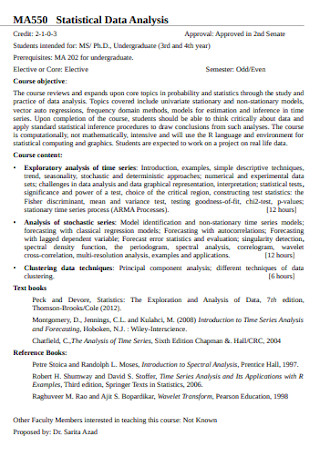
Statistical Data Analysis Example
download now -
Preliminary Data Analysis
download now -
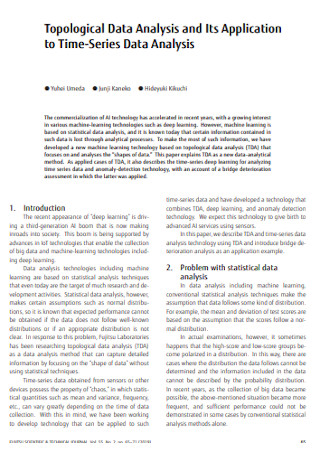
Topological Data Analysis Template
download now -
Life Data Analysis Template
download now -
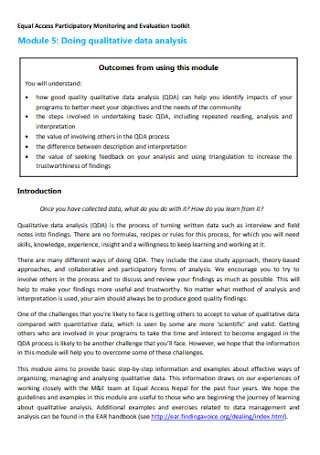
Sample Qualitative Data Analysis Template
download now -
Cost of Data Analysis
download now -
Challenges in Visual Data Analysis
download now -
Visual Data Analysis Systems Template
download now -
Measurement Data Analysis
download now -
Data Analysis Request Example
download now
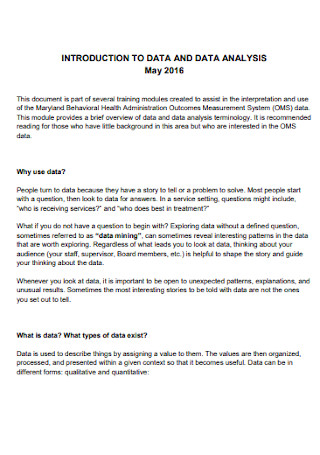
What Is Data Analysis?
First of all, data refers to a collection of facts, statistics, and more. Meanwhile, analysis is the breaking down of data, whether quantitative or qualitative, into separate aspects. And each component is examined after. Mix both terms, and you have data analysis. Thus, it is the systematic process of gathering raw data and investigating information. Many researchers and businesses depend on it to extract information and make decisions using the results shown in the analysis.
Based on a 2012 study, only 0.5% of the 2.8 ZB worldwide data supply was used for analysis.
According to Statista, the big data and business analytics market worldwide reached up to $168.8 billion in 2018.
On the other hand, Investopedia reported, via the US Bureau of Labor Statistics (BLS), that 20% of new enterprises tend to fail in the first two years they open.
Why Is Data Analysis Important?
Did you ever wonder why your business is getting less and less profitable? It might have something to do with how your mistakes blind you. Do not let that problem continue as there is even a survey that proved how 20% of new businesses usually fail from the first two years. Many owners hate hearing the truth, but there is a need to acknowledge mistakes and learn from failures. In adding data analysis to the picture, like market and SWOT analysis, better decision-making follows. Hence, analyzing business-driven data is an essential tool to reach success.
Aside from business, data analytics and analysis play a significant role in other factors. An example is for your thesis or research. Remember the problem-solving process? It starts with the statement of the problem down to the conclusion. Analysis works just like that. Aside from data collection, the process leads to formulate questions, test the hypothesis, answer questions, and interpret results.
Lego Toys: How Data Analysis Plays in Business
Are you familiar with Lego? Those are small toys of plastic bricks that children play to build whatever their imagination wants them to create. Although the brand was a hit starting in 1949 and up to how many years, Lego eventually suffered in sales. According to eCMetrics, merely 10% of young girls played with Lego. As Lego learned about that data, its business analyzed through research and market analysis to target the female audience too. What did they do? Lego added dolls or figurines and vibrant colors to their new line. Hence, it appealed to young girls. Just like that, sales skyrocketed, and you just witnessed a real example of how beneficial data analysis is.
What Are the Types of Data Analysis?
Statista informed us that the big data and the business analytics market around the globe were around $168.8 billion in 2018. With that amount, it displays how various businesses take data-driven analysis and analytics seriously. But did you know that data analysis does not simply work in one way? There are even many examples which you may like to follow. And the common types of data analysis are the following:
How to Process Data Analysis
In 1961, a great statistician named John Tukey described data analysis as “procedures for analyzing data.” It is no surprise that a set of processes is present. And you identify each procedure through steps. Otherwise, processing without an organized sequence could lead to jumbled results, or worse—failure. Check out these easy steps on how to process data analysis effectively:
Step 1: Set a Purpose
Why do you plan on conducting data analysis in the first place? Thus, define your purpose properly since the first step involves data requirement gathering. Do you want to prove or disprove a theory before contributing something new to science? Or maybe you need to identify your company’s weakness to beat your competitors afterward? Whatever it is, set the objectives straight to understand what to investigate and why. And right from the get-go, decide what type of data analysis to use.
Step 2: Collect the Data
Right when you finish the requirement gathering process, you are wholly aware of what to examine and what your findings will be. Next, proceed to data collection. But you only gather data based on the requirements earlier. Be sure to select from numerous sources like a research survey, flowchart, statistical graph, and more. However, do not blindly collect everything. Check your references if they are credible or not. One tip to know how reliable your source is, for online facts, is to check the site’s domain authority.
Step 3: Clean All Info
What is data cleaning? It refers to excluding some of the collected data that is no longer relevant or helpful to your analysis. A common mistake some analysts do in collecting information is when they gather too much. Some parts might be unnecessary, and those have to be taken out—or cleaned. First, exclude duplicate records. There is no need to reiterate statements that are exactly the same or mean the same thing. More so, errors are unwelcome. To err in data already leads to errors in results. In short, conduct a thorough review of your details in cleaning.
Step 4: Analyze the Data
So is your data complete and cleaned already? Great, proceed to the most critical part, which is to analyze your data. There are many data analysis software and tools you could use, like Xplenty and Microsoft HDInsight. That way, you will find the analyzing process convenient. This part lets you comprehend the results clearly. Also, don’t be close-minded. Results may be surprising, and there is plenty of new information to learn for sure.
Step 5: Interpret Results
Of course, data interpretation should be part of the picture when you finish the analysis. Do you want to express your findings through words, tables, charts, or any other graphic organizer? So be it. Adding visuals helps a lot when you plan to discuss the results further to another audience. Infographics and visual organizers make presentations easier to understand anyway. Discuss the datasets according to their relationships, patterns, effects, and so forth. The key is to fully understand such results because if you find it complicated, then so will your audience.
Step 6: Take Action
Lastly, plan on the best course of action. The results in the analysis are not for naught since those are useful in deciding what to do next. Since you already have the insights and knowledge of the data, how to apply those afterward is the challenge. For example, an analysis proved that poor marketing caused your business a sales decline. Do not stop there. Take action by plotting the best marketing plans and techniques to be more lucrative soon.
FAQs
What are the examples of the best data analysis tools?
Aside from Microsoft HDInsight and Xplenty, there is plenty of data analysis tools to choose from. Other examples include Apache Spark, Elasticsearch, Lumify, Plotly, Skytree, Splice Machine, and Talend.
What are the important methods of statistical data analysis?
It is fundamental to prevent pitfalls and maximize sophisticated strategies or techniques in statistical data analysis. So, the process involved five methods that work together in reaching the best results. These are the mean, standard deviation, regression, sample size determination, and hypothesis testing.
What is a data analyst?
A data analyst practices the analysis and interpretation every day. Specifically, analysts collect data in various aspects like sales, marketing, logistics—you name it. And they use such data to benefit enterprises in creating better and wiser decisions.
Tim Berners-Lee, aka the inventor of the World Wide Web, once said, “Data is a precious thing and will last longer than the systems themselves.” So while you have plenty of data gathered now, be sure to analyze and make use of such information to benefit what comes after. At some point, your business may stop operating. Or perhaps, you already have a new successor after passing the torch in retirement. But what else remains? Data. Researchers and other business owners would learn a thing or two from the mark you left.