52+ Sample Venn Diagram Templates
-
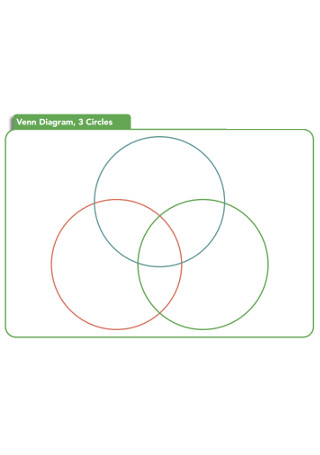
Venn Diagram Three Circles
download now -
Sample Venn Diagrams Template
download now -
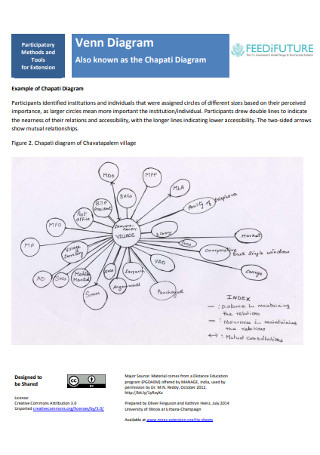
Venn Chapati Diagram Template
download now -
Simple Venn Diagrams
download now -
Basic Venn Diagrams Template
download now -
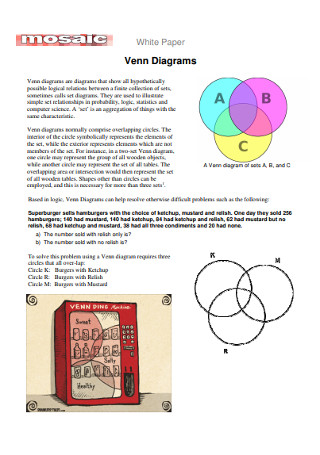
White Paper Venn Diagrams
download now -
Logical Venn Diagram Chart
download now -
Circle Venn Diagram Template
download now -
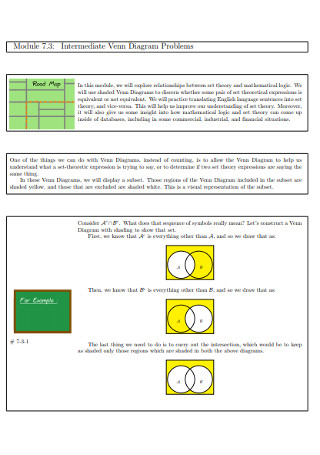
Intermediate Venn Diagram Problems
download now -
Exam Venn Diagram Template
download now -
Education Venn Diagram Template
download now -
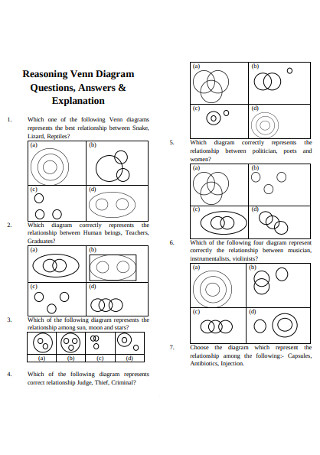
Reasoning Venn Diagram
download now -
Classroom Assessment Venn Diagrams
download now -
Venn and Cardinality Diagrams
download now -
Graphic Organizer Venn Diagram
download now -
Sample Venn Diagram Problems
download now -
Two Set Venn Diagrams Template
download now -
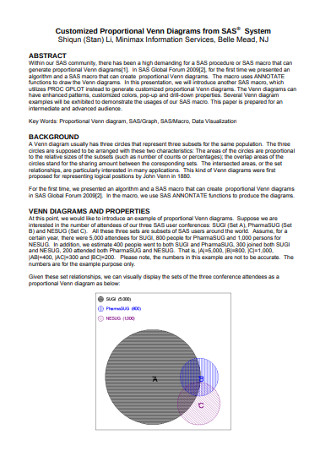
Customized Proportional Venn Diagrams
download now -
Software Venn Diagram Template
download now -
Methods of Venn Diagrams
download now -
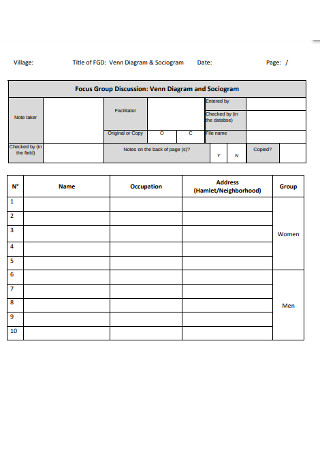
Venn Diagram and Sociogram Template
download now -
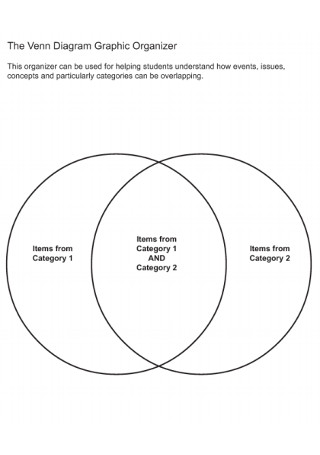
Venn Diagram Graphic Organizer
download now -
Simple Venn Diagrams Template
download now -
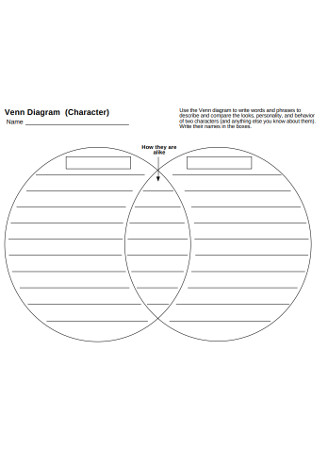
Venn Charector Diagram Template
download now -
Basic Venn diagrams
download now -
Venn Shading Diagrams Template
download now -
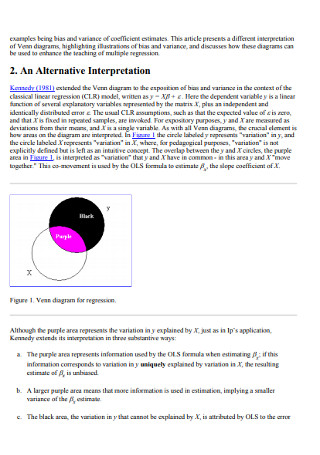
Venn Diagrams for Regression
download now -
Standard Venn Diagrams Templates
download now -
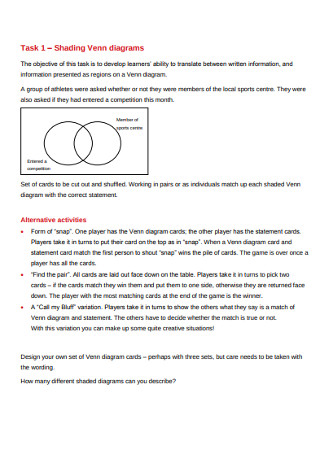
Sample Shading Venn Diagrams
download now -
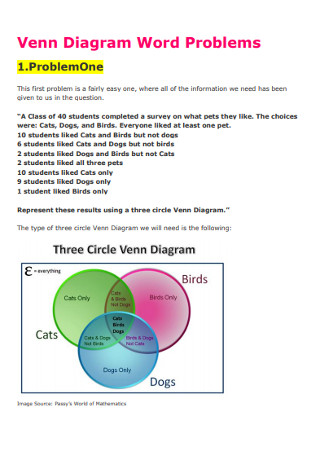
Venn Diagram Word Problems
download now -
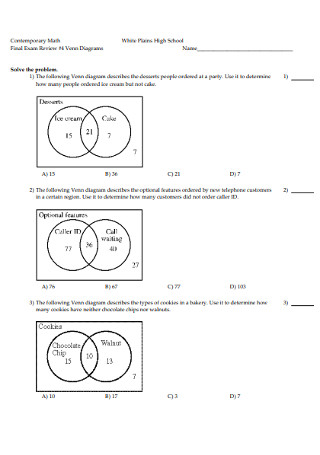
High School Venn Diagram
download now -
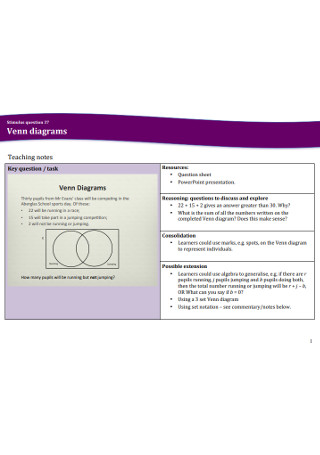
Teaching Venn diagrams
download now -
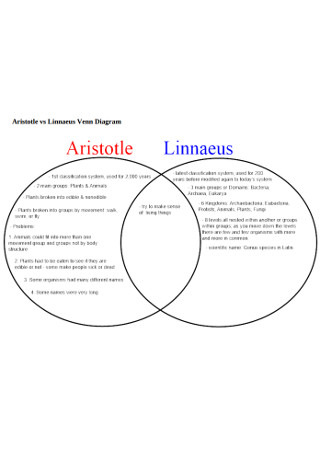
Linnaeus Venn Diagram Template
download now -
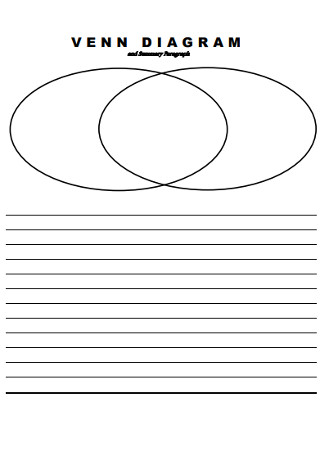
Venn and Paragraph Daigram Template
download now -
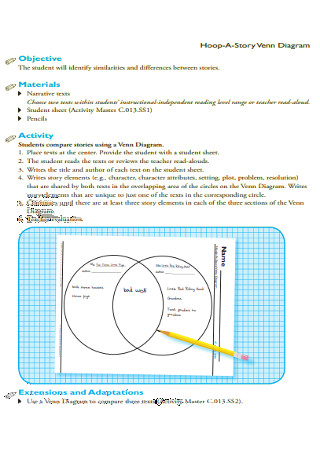
Story Venn Diagram Template
download now -
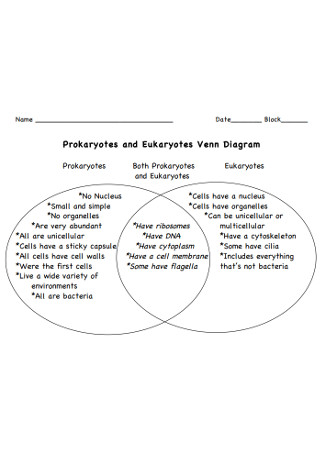
Eukaryotes Venn Diagram Template
download now -
Relationships Venn Diagrams
download now -
Probability and Venn Diagrams
download now -
Venn and Set Operations Diagrams
download now -
Set Theory and Venn Diagrams
download now -
Venn Colours Diagrams
download now -
Maths Venn Diagram Template
download now -
Circle Venn Diagram Template
download now -
Logical Venn Diagrams
download now -
Triple Venn Diagram Templates
download now -
Binary Numbers and Venn Diagram Template
download now -
Goods Venn Diagram Template
download now -
Venn Communities Diagram Template
download now -
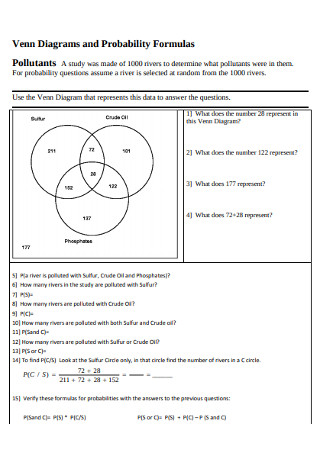
Venn Diagrams and Probability Formulas
download now -
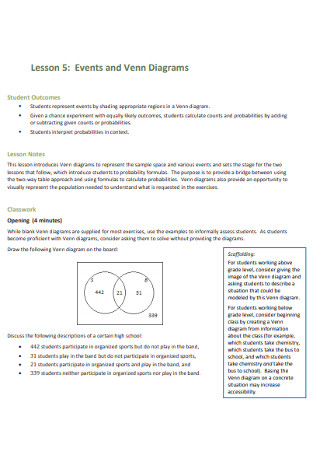
Events and Venn Diagrams
download now -
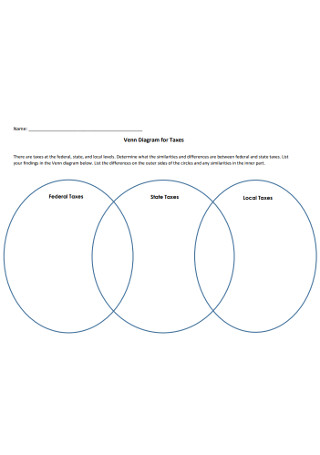
Venn Diagram for Taxes Template
download now -
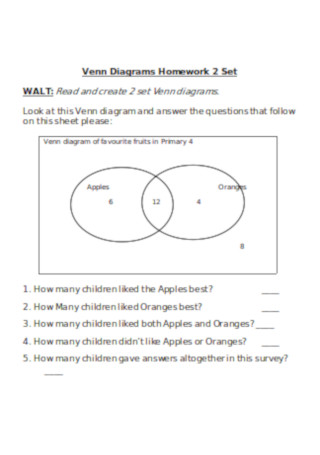
Venn Diagram Homework Template
download now -
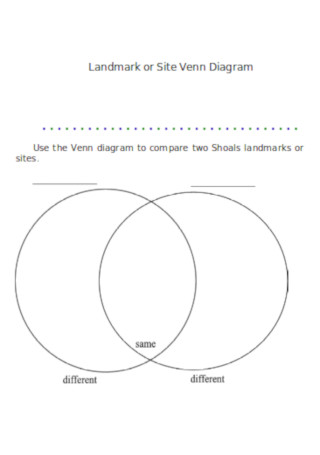
Landmark or Site Venn Diagram
download now
FREE Venn Diagram s to Download
52+ Sample Venn Diagram Templates
What Is a Venn Diagram?
Diagram Vocabulary
Sketched into Popularity: The Venn Diagram Story
Multi-disciplinary Applications
How to Use the Venn Diagram
FAQs
What do you call the center of a Venn diagram?
Why is it called a Venn diagram?
What is a Venn diagram in simple words?
What are the Venn diagram symbols?
What is the name of a three-circle Venn diagram?
How can I make a Venn diagram?
Can I make Venn diagrams in MS Excel?
What Is a Venn Diagram?
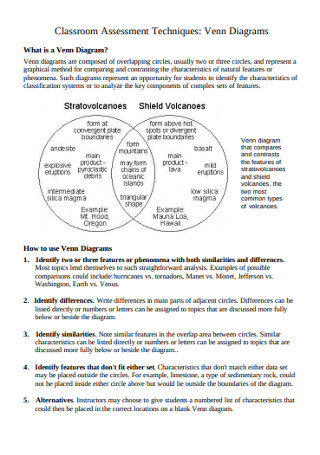
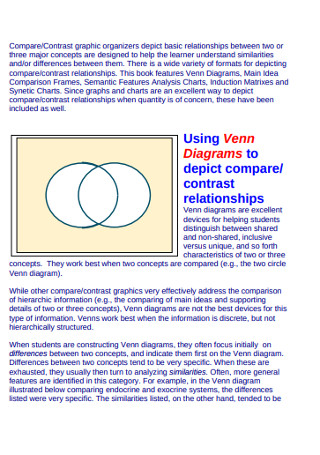
Venn diagrams do what diagrams do best: they communicate complex concepts through illustrations and caricatures. Processing thoughts through visualizing them is an effective learning strategy. Visual learning feels natural for many since we’ve been using our sense of sight to make critical connections and distinctions—between predator and prey, for example—to survive. Admittedly, it is easier for us to compare and contrast two objects when we arrange them based on their similarities and differences. Diagrams are a pictorial representation of the relationships of concepts with each other.
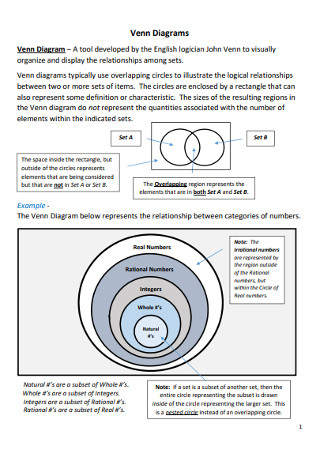
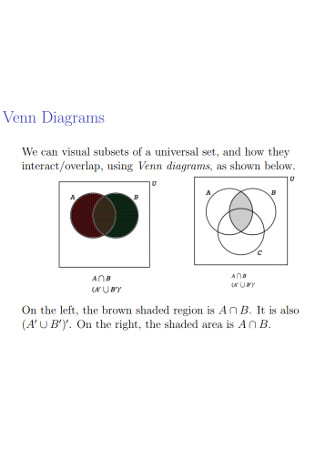
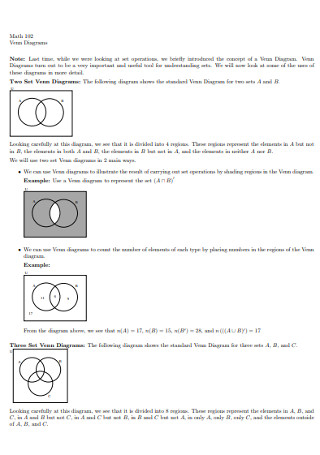
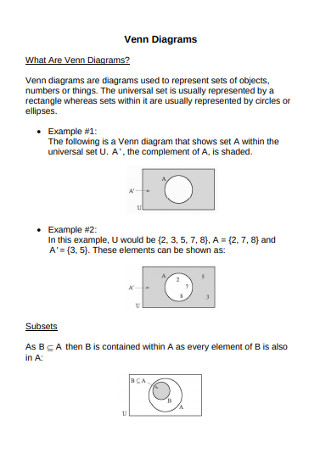
In its simplest form, a Venn diagram consists of two circles that overlap slightly on one side. One circle represents one concept. When you are comparing two concepts, then there will be two circles. In the non-overlapping area of the circle, the writer lists down the characteristics that are unique to either concept. Logically, one would interpret the overlapping region as something shared between the two circles. In that blank space, the writer can list down the traits common to both concepts. In some cases, especially in math, the two or more circles are enclosed in a rectangle.
Diagram Vocabulary
The Venn diagram’s design is simple and straightforward. That makes it suitable for any situation where we feel we need to compare objects. In disciplines outside math and statistics, the following words may not be used as much. However, it is important to learn about these terminologies as they help us understand how a simple schematic of two or more intersecting circles can say a lot about the relationships of one thing with the other.
Sketched into Popularity: The Venn Diagram Story
If there is a club for popular graphic organizers, the Venn diagram may be its leader. At least after it talked things through with the flow chart, which has a huge following, too. The two overlapping circles is a famous choice for organizing thoughts and illustrating relationships. But how did it achieve celebrity status?
You can say that it was not the only one of its kind. Its less refined ancestors appeared at different points in the history of the diagram, starting from the early 1200s when an academic used a similar illustration. More than 400 years later, a similar illustration reappeared in the works of scholars. Its closest ascendant is the Euler Diagram, made by the mathematician Leonhard Euler. You may be familiar with this Swiss mathematician’s legacy: the Euler’s constant. He was an influential figure in the world of mathematics. So much so that his diagrams were among the inspiration of logician John Venn in creating the Eulerian Circles. The latter was only later termed Venn diagram in a book on logic.
The diagram was born from Venn’s interest in logic and probability theory. He used diagrams to understand and demonstrate the nature and relationships of groups or sets. It also became a popular tool for academics and scholars in depicting relationships. This graphic organizer has built its reputation on its usefulness and versatility in logic and other disciplines. That is why it is one of the fundamental and foundational lessons kids learn in their early education all over the world.
Multi-disciplinary Applications
Schools don’t just teach kids about Venn diagrams for the sake of tradition. One of the perks of its simplicity is that it is also a versatile tool for understanding and illustrating. You can build on the basic two-circle design and use five circles. You can also mix it up and play with the structure to effectively encapsulate information. There are different disciplines that benefit from the diagram’s versatility.
Logic and Mathematics
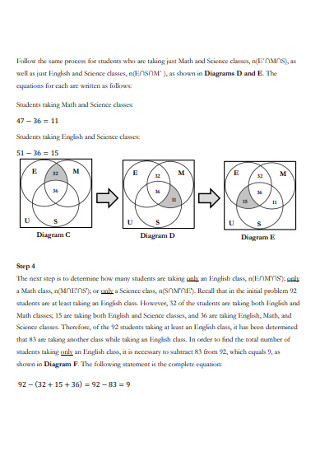
You can’t take away the diagram from logic and math. It is the brainchild of both academic disciplines. You can use the diagram to test, analyze, and present certain arguments and their relationship. You can use it to check if the argument is valid. In math, you can use the diagram to solve problems from simple to complex. Mathematics adheres to the use of specific terminologies, like sets, unions, and intersections. The discipline has a branch dedicated to the study of groups and their relationships. The branch is called set theory.
Statistics and Probability
The Venn diagram is also useful in studying the outcomes of events. Statisticians look at how likely an event will occur based on its similarities with the previous event. With the help of the diagram, the likelihood of an event to occur can be predicted by adding individual probability.
Education
A Venn diagram is a useful learning aid and instructional material. It can simplify a lengthy text into a simple graphical representation. It is also easier to learn when the information is digestible. Especially for young learners, it can be hard to follow through texts upon texts. Educators can demonstrate the relationship between concepts using the diagram. It also helps the students’ comprehension.
Business
You can also use the diagram in business presentations. For instance, you are preparing a slide presentation about how your product can compete with the other brand’s item. Instead of filling your slide with words, you can illustrate your point with the diagram. It is useful in making comparisons in your reports.
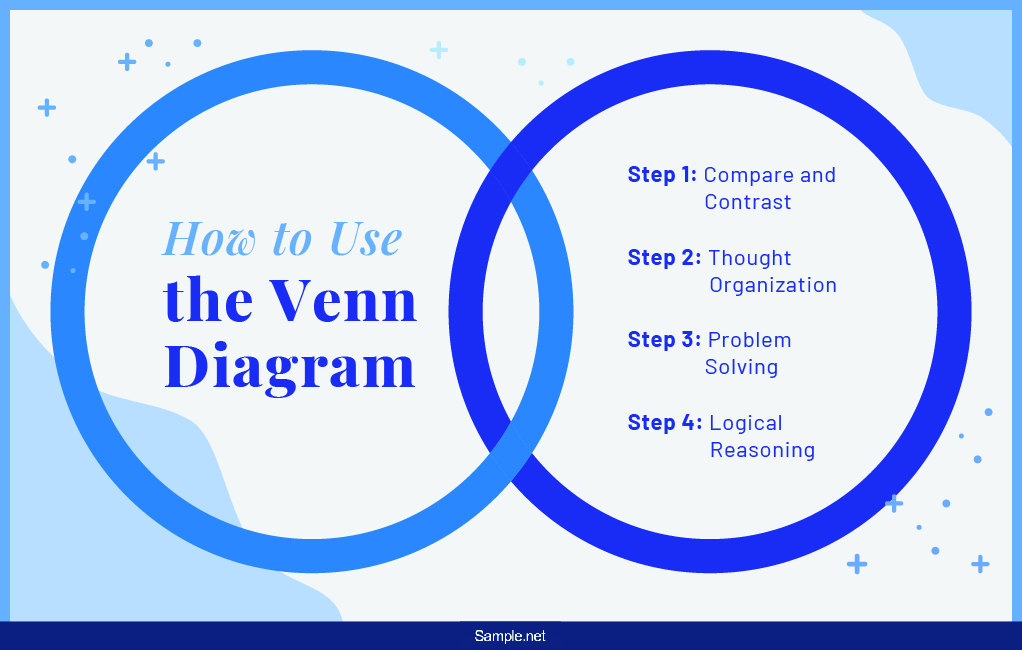
How to Use the Venn Diagram
Whether you are a student or a professional, you can have different uses for the diagram. The following are some of the applications where a Venn diagram is appropriate.
Step 1: Compare and Contrast
The diagram depicts commonalities and differences between or among the objects compared. It makes sense that the basic use of Venn diagrams is to directly look at how one thing relates to another. You can use it to see the relationship for yourself or demonstrate the dynamics to others.
Step 2: Thought Organization
It is a graphical organizer, after all. You can use the diagram to organize ideas and thoughts. Maybe you need help in deciding which item to buy. Or you want to picture out how related a particular event is to a bigger situation. In whichever case, you can decide how you will utilize the diagram.
Step 3: Problem Solving
Mathematicians can use the diagram in dealing with advanced problems. They can use it to inspect the logical relationships between sets. Engineers, academics, computer scientists, and statisticians all have found appropriate uses of the diagram in their fields of focus.
Step 4: Logical Reasoning
Venn diagrams are useful in evaluating categorical syllogism. You can visualize the given premises as a diagram. From inspecting the structure, you can determine whether the conclusion is valid or invalid. Sometimes the propositions give the answer away, but Venn diagrams can help you be sure. It helps you evaluate the logical problem fast, too.
FAQs
What do you call the center of a Venn diagram?
The region where the two or more circles intersect is called the intersection of the sets or intersection.
Why is it called a Venn diagram?
The diagram was named after the English logician, John Venn, who popularized it.
What is a Venn diagram in simple words?
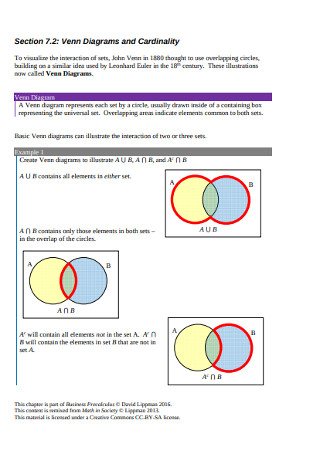
It is a compare and contrast diagram with two or more intersecting circles. The non-overlapping region houses the unique traits of each object. The intersection shows what all the compared objects have in common.
What are the Venn diagram symbols?
The Venn diagram follows specific set notations. The wide u represents union. This means “and.” The wide n represents intersection. This refers to “or.” The A with the superscript c represents the complement of set A. When B has the superscript c, it refers to the complement of set B. The complement of set A is the elements or characteristics that are not present in set A.
What is the name of a three-circle Venn diagram?
It is called a three-circle Venn diagram. The intersection of the three circles is called a Reuleaux triangle.
How can I make a Venn diagram?
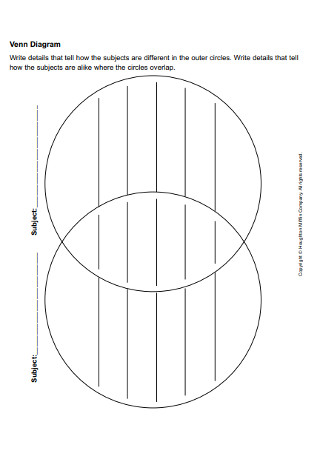
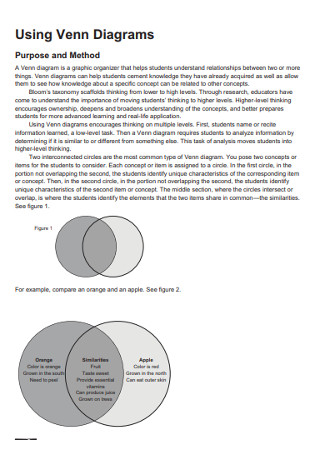
Draw two circles with one of each circle slightly overlapping the other. Label the overlap as similarities. Write the name of the two objects you are comparing on either circle. You can also download a printable template from the ones we prepared for you.
Can I make Venn diagrams in MS Excel?
Yes. You can find the diagram that you want in the SmartArt option. You can customize and edit the diagram so that it is appropriate for your needs.
Venn diagrams have gone a long way. From complicated mathematical problems to things like, ‘which canned drink should we buy,’ we have benefited from learning how to categorize choices to make our decisions. Diagrams make our life easy. They help us picture out information that is otherwise reflected in a lengthy paragraph. We also understand the relationships of ideas better when we illustrate them into the simple circles and lines of diagrams. Who knew something as simple as two circles that couldn’t overlap completely could be so versatile?