6+ SAMPLE Quarterly Sales Activity Report
-
Quarterly Sales Business Activity Report
download now -
Quarterly Sales Volume Activity Report
download now -
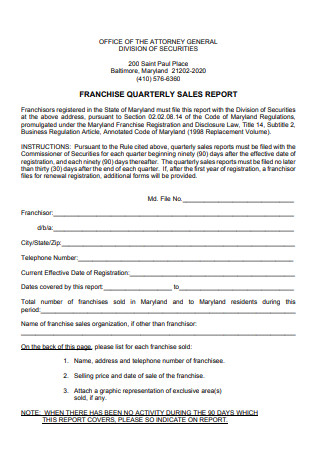
Franchise Quarterly Sales Activity Report
download now -
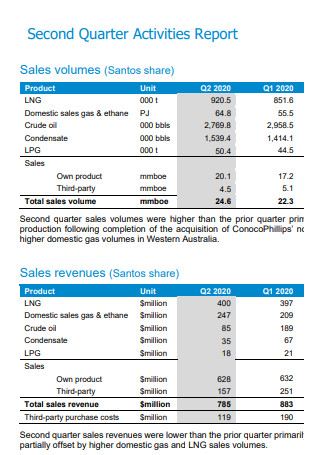
Second Quarterly Sales Activity Report
download now -
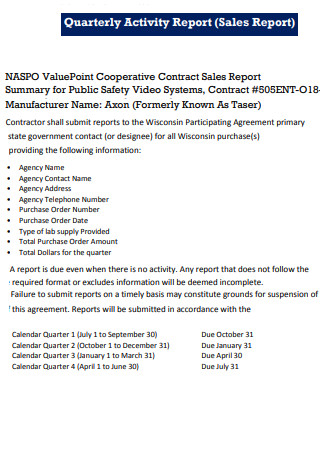
Quarterly Cooperative Sales Activity Report
download now -
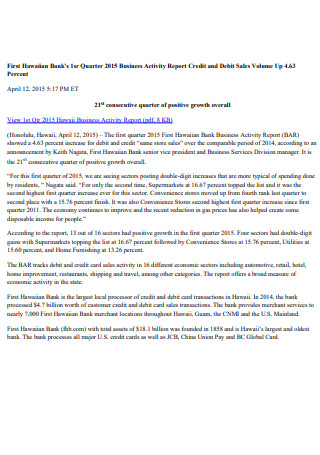
Bank Quarterly Sales Activity Report
download now -
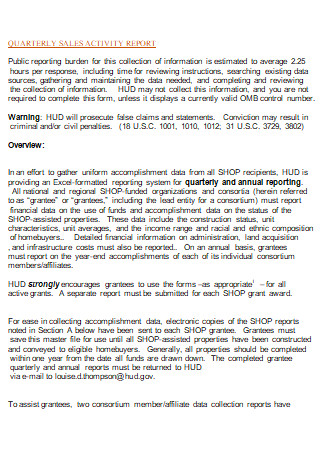
Quarterly Sales Activity Annual Report
download now
FREE Quarterly Sales Activity Report s to Download
6+ SAMPLE Quarterly Sales Activity Report
a Quarterly Sales Activity Report?
Benefits of Quarterly Sales Activity Report
Types of Monthly Sales Activity Reports
How To Write a Quarterly Sales Activity Report
FAQs
What is an Activity Report?
What is a report on sales analysis?
What do daily reports entail?
What Is a Quarterly Sales Activity Report?
A sales activity report is a critical tool for improving your team’s performance and generating significant sales outcomes. This report does not simply provide revenue; it is a document that describes a business’s sales operations. Typically, this sales report includes sales volume, leads, new accounts, revenue, and costs for a specified period. It may illustrate the various patterns in sales volume over time, but it also evaluates the multiple stages of the sales funnel and the performance of sales executives. Daily, monthly, quarterly, and annual sales activity reports are generated. A quarterly sales activity report is used to determine whether or not sales target goals and revenue have been met, review the previous quarter’s sales results, and prepare for the next successful quarter. Also, it can assist you in resolving sales management challenges, identifying seasonal swings, observing the effects of marketing efforts, and identifying particularly successful sales representatives. According to statistics, 5-10% sales growth is acceptable for large-cap organizations, whereas sales growth of more than 10% is more attainable for mid-cap and small-cap companies.
Benefits of Quarterly Sales Activity Report
Businesses have recognized that sales reports enable them to better understand their workforce’s difficulties and make timely corrections. However, from the salesperson’s standpoint, this is a pointless activity — much more so when there is no genuine update to share. On the other hand, managers should be aware of daily team updates to make informed decisions about investing their time and resources. Also, automating creating daily reports reduces the amount of work required. Numerous firms utilize sales CRM software that automatically provides daily reports based on business KPIs without requiring users to take any action. Let’s dig deeper into why quarterly sales activity reports are critical and how you may streamline the process. The following are a few ways to help accelerate your business’s sales success and growth.
Types of Monthly Sales Activity Reports
A monthly sales report is used to track, evaluate, analyze, and forecast monthly sales patterns. It provides longer-term tracking of key performance indicators (KPIs) such as sales cycle duration, conversion report, and monthly performance report. To delve a little deeper, we’ll also briefly discuss some functional monthly sales report samples. A month will provide you a better sense of how your sales reps are performing over time, even though, as previously stated, it may be too late to adopt corrections to prevent missing out on possibilities.
-
1. Sales KPI report
We’ll begin with a sales report example that focuses on high-level indicators designed to make the life of c-level executives considerably easier. Critical data such as revenue, churn rate, profit margin, and incremental sales should be reported at these levels. These variables are crucial to track every month because they can alter its sales strategy path. Sales vice presidents, managers, and executives can monitor vital operational and strategic data to improve the quality and execution of specific sales targets. Using professional KPI software, this monthly sales report template may be prepared in minutes.
2. Sales opportunity report
A sales report template for sales managers should include information on opportunity management, development, monitoring, and analysis. These are the funnel’s most noticeable leads, and they require special attention and care. Professional business intelligence reporting systems consolidate opportunities in a single, central location, and automatic data updates enable real-time data analysis without manually optimizing various spreadsheets and static reports. The sample sales performance report above is focused on prospects and includes detailed information about multiple indicators. It begins with a high-level review of current opportunities, current purchase value, average buy value, and win ratio compared to the previous month. This will immediately indicate whether your developments are favorable or require extra tweaks to achieve the desired outcome. The causes for churn are detailed below, and we can observe that most lost opportunities claim that they choose a rival. You can use these data to investigate what competitors offer and see whether you can adjust your sales methods to provide a better value offering to your most potential leads. The right section elaborates on the buy value with the opportunities, allowing you to follow your progress throughout the month and analyze what occurred during key spikes to repeat optimistic scenarios and learn from negative ones.
3. Sales cycle length report
This monthly sales report sample covers the entire sales funnel for your reps, from the opportunity to concluded contract. It will detail each rep’s performance and demonstrate how effective they are at closing transactions and how long it brings them to do so. Visualizing these indicators will assist you in assessing each individual’s strengths and shortcomings, providing you with the information necessary to respond appropriately.
4. Sales & order report
Another functional monthly report template for internet retailers. With so many orders to process, it can be challenging to keep track of everything sent out – but almost always returned. While every shop strives to increase sales volumes, successfully handling the return process will benefit you on numerous levels. In this manner, you can quickly boost customer happiness, and as we all know, satisfied clients will return and suggest your products and services to their friends and family. And that is what you want to accomplish.
5. Sales performance report
As our last monthly report style, we chose one that provides a comprehensive overview of your performance by aggregating many distinct KPIs – which is advantageous if you opt to make a monthly report. This sales analysis report sample provides you with at-a-glance information to determine whether your teams are meeting their objectives quickly. In practice, this performance dashboard allows you to monitor client acquisition expenses, average revenue per unit, customer lifetime value, and trending data. It is critical to analyze and evaluate your performance regularly. This will foster an informed sales environment where you can make decisions based on data rather than “hunches” or assumptions that can cost you substantial amounts of money and time.
How To Write a Quarterly Sales Activity Report
According to research, a small business may spend up to 20% of its income-seeking sales leads. This rate can exceed 45 percent for newer companies. With so much money being spent on sales, it’s reasonable that you, your sales staff, managers, executives, and external investors would want to see regular overviews of your sales KPIs. That is where quarterly reports on sales activity come in. If you’re still interested, the following steps will assist you in making your report.
-
1. Determine the appearance of your quarterly sales report.
A quarterly sales report should consist of more than just numbers and reasons. It should also be appealing to the eye and simple to read without becoming overwhelming. You can do this by downloading a sales report template or using your customer relationship management (CRM) software to quickly create a variety of report kinds.
2. Take into account your audience and include the necessary facts.
You may wish to include a lot of KPIs in your report to your head of sales if you’re a high-ranking sales team member. Executives might prefer a more condensed summary. Furthermore, a CEO may be more interested in data than a CFO. Your CRM software should be able to assist you in reformatting your sales data for any target audience. You can decide to include or exclude particular data sets, such as sales income and costs, period-to-period KPI change, progress toward sales targets, sales by product or service, sales forecasts, and future sales plans.
3. Calculate your current and prior periods.
Based on the frequency criteria given above, it will help you decide whether the information you wish to transmit is best presented in an annual, monthly, weekly, or daily view. After that, you should compare your data from this period to data from a similar period in the past.
4. Compile your information.
It’s time to compile your data once you’ve determined your information requirements and data period. This phase usually entails logging into your CRM software and retrieving data. You can then save for use in another program or transform them into reports directly from your CRM dashboard. In any case, sales reporting is more than just putting your data in one place.
5. Professionally present your data.
Quarterly sales reports should be more than just a collection of figures. To help your audience understand these numbers, you should add plenty of graphs and other helpful pictures. Of course, you should select the appropriate graph type. A line chart, for example, would be required in an annual report to demonstrate revenue month over month. Your CRM program may generate these charts automatically, or you can utilize Excel to help you create graphs.
6. Make sure your data and details are correct.
After you’ve gathered your information and developed charts and graphs, go back to stages one and two to assess your audience and include relevant information. Also, you may not realize you’ve included too much or too little material until after you’ve completed your initial draft of a report. Don’t be hesitant to remove data, redo graphs, or seek advice from a fellow sales team member. Remember, everyone requires the services of an editor. Before you walk into your meeting, it’s critical to create a balance between understanding and oversupply.
7. Explain your findings.
This final step is possibly the most critical. Again, simply giving data is only half the battle; you must also provide your data context for it to make sense to your audience. For instance, if your monthly report indicates a fall in sales from the prior period for the first time in several months, do not expect that your audience would infer the reason for the decline. Provide evidence that the reduction results from a seasonal slowdown exacerbated by an economic slump. Additionally, you should begin each report with a written summary of the preceding period’s data. Your written explanations should justify your figures. They should also describe the corrections that your team intends to make. For instance, if a key competitor’s limited-time discounts have resulted in a decrease in your sales, tell how you intend to reclaim the clients lost as a result of the promotion. Even the most alarming data can be presented meaningfully if an actionable, fixable root cause is identified. Once you take action, your sales may grow. This is where the sales report’s value lies.
FAQs
What is an Activity Report?
Depending on the organizational context, an activity report may be referred to by various terms: work log, progress report, project update, or status report. Activity reports are a type of workplace communication that accurately and succinctly reflects the status of a project.
What is a report on sales analysis?
The sales analysis report collects analytical data that gives an overview, trends, and specifics on a plethora of indicators relevant to the sales process and its outcomes, used by company leadership to monitor and enhance sales dynamics.
What do daily reports entail?
A daily report is an electronic document that contains information about an insurance policy. It may include the premium amounts, the date of issue, and the insured’s name, among other things. Daily reports are frequently distributed to insurance brokers, insurers, and other contract parties.
A properly-written quarterly report on sales activity can assist top management in determining which sales activities are performing effectively and which require improvement. Once the appropriate data are in place, goals and objectives are adjusted or added to reflect market trends and consumer behavior to increase sales.