18+ Sample Analytical Reports
-
Analytical Report Template
download now -
Analytical Business Report of Project
download now -
Sample Data Analytical Report
download now -
Formal Analytical Summary Report
download now -
Simple Marketing Analytical Report
download now -
Healthcare Analytical Report Format
download now -
Healthcare Laboratories Analytical Report
download now -
Formal Short Analytical Report
download now -
Consultation Written Analytical Report
download now -
Environmental Analysis Executive Summary Report
download now -
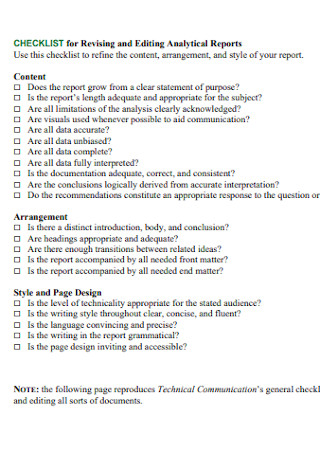
Analytical Report Writing Checklist
download now -
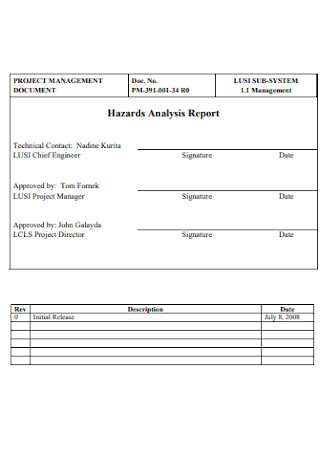
Hazards Management Analysis Report
download now -
Analytical Informational Framework Review Report
download now -
Financial Custom and Analytical Report
download now -
Analytical Recommendation Report
download now -
Global Research Analytical Reports
download now -
Generating Customized Cover Analytical Reports
download now -
Environmental Memorandum Analytical Report
download now -
Basic Evaluation Analytical Report
download now
FREE Analytical Report s to Download
18+ Sample Analytical Reports
What is an Analytical Report?
The Main Types of an Analytical Report
Benefits of an Analytical Report
Basic Components of an Analytical Report
How to Create an Analytical Report
FAQs
Why is using an analytical report template essential?
What are the fundamental elements of the analytical report?
How to write an effective analysis report?
What are some examples of data analysis?
What are the three steps of data analysis?
What is an Analytical Report?
An analytical report is a significant document that has an aim of providing in-depth, systematic explanations of a particular research matter according to the original perceptions, experiences, or behaviors of different individuals or groups. As an efficient research analyst, you become aware concerning the quality and dimensions of those perceptions, experiences, or behaviors for a research project while doing some interviews, focus groups, participant observation, and/or reviewing their written documents.
Many organizations continue to find ways to improve efficiency and control costs in their businesses. Based on the U.S. Bureau of Labor Statistics, there is a projected idea that employment of management analysts will potentially grow 11% from 2019 to 2029, which appears to be much quicker compared to the average for all types of occupations. Thus, all kinds of analysts must be skilled in creating an effective analytical report for their company and organization, as well as having strategic reasoning tactics, experience getting support from others, and strong emphasis on data and research.
The Main Types of an Analytical Report
Many professionals and people working in creating tables or charts for data analysis typically select a wide array of reporting tools such as Excel, QlikView, Tableau and many others. To assist you in improving business efficiency, we will introduce and explain to you about the main types of analytical reports below:
1. General Reports
These reports appear to be most common in various business firms and organizations. Professionals and other people use general reports for chart design, data entry, parameter query, and many others. Also, general reports can be separated into column report, crosstab report, detail report, grouped report, and many other kinds of reports.
2. Aggregate Reports
Consisting of numerous modules, aggregate reports can be comparable to charts and reports. If you are making complex reports due to a large workload in a particular project, you can use aggregation reports as these reports are able to solve issues in having irregular enormous reports. As the expansion, column width, and row height in the middle of the blocks do not disturb each other, the flexible space for tabulation in the report immensely improves.
3. Dashboard Reports
When it comes to solving decision-making issues in various business firms and organizations, dashboard reports can be your best friend. With the use of simple drag and drop operation, you can set up a comprehensive management data thanks to its canvas-like operation interface. In order to accomplish muli-dimensional data analysis in your work, you can demonstrate different types of business indicators in the same page.
4. Progress Reports
After you gather some data and other details based on your research about a particular trend, business project, assessment, or other kinds of work, this information can be used in creating progress reports. These reports are made for various purposes and mainly for monitoring, evaluation, and comparison of ongoing or completed activities, tasks, and many others, as well as in analyzing the development of particular areas being observed.
Benefits of an Analytical Report
There are countless benefits that every business firm, corporate groups, institutions, and other organizations can get from writing an analytical report. Apart from keeping track of the data and statistics, it can also help the office teams and departments to gain sufficient knowledge, and understanding of the enormous amount of information concerning the research or business project.
Brian Balfour, the founder and CEO of Reforge and former VP of growth at Hubspot once said: “As you gain fresh insight from your data, it opens the door to new questions. As you have new questions, you need to update your instrumentation and analysis. Saying the process is “done” is saying you understand everything there is to know about your users, product, and channels.” Below are some of the benefits of using a structured analytical report:
1. Effective Productivity
Developing an analytical report is a method that will provide you a bird’s eye perspective of your internal processes in the business or research work. This process may help in setting order in improficient processes that still exist, as well as in encouraging your team members to concentrate on doing strategic methods and tasks. Thus, it can facilitate development in the project planning and processes of the company or organization.
2. Better Communication and Team Collaboration
Conducting effective analysis can help your business and team members to gain meaningful visual insights and much needed information which will assist in their better performance and support clear communication inside the workplace. This will also avoid any possible interdepartmental conflicts and misunderstandings because of data inaccuracy. Plus, all of the members in the team or department will be constantly on the same page which can elevate team collaboration at its finest.
3. Support New Developments and Changes
Because we are living in an IT generation, digital technology continues to change and is on the rise in various sectors and industries around the world. Today’s technology may possibly not work over the next few years and decades. That’s why being up-to-date and sailing along with the current changes is very integral to continue thriving. This also applies in analysis reporting because it gives 24/7 access to historical data, real-time data with the help of reporting automation, and predictive features. By responding to continual change, this will help your business to cut down operational costs and preserve staff engagement.
4. Become the Leading Edge
Using a wide selection of valuable key performance indicators (KPI), you can obtain dynamic data visualizations which are made to offer deep insights into your work or organization’s most crucial functions and processes. In this way, you will have the skills and expertise in pinpointing weaknesses, capitalize on trends, reveal insights, or patterns which seemed to be non-existent and develop accurate predictions. Then, your business can have continuous growth and become the leading edge in the industry.
Basic Components of an Analytical Report
In this section, you will learn how to craft a well-written and logical analytical report if you want to display the growth, and development of your business to the management, executives, investors, and many others. However, an analytical report has different components. Include the following elements for you to create an outstanding document:
How to Create an Analytical Report
Creating analytical reports and assessments need to focus on the form, not the substance because you will use your documents to share with others and help them understand the main topics of concern, as well as completing the tasks assigned. Aside from developing crucial decisions in analytical report writing, an analytical report can effectively outline your definite ideas and solutions according to evidence like reliable data.
Douglas Cohen, who spent many years as an analyst, said: “Good analysts always challenge what they have been told or given.” So, you need to work hard in determining and measuring various data so that you are able to come up with great decisions. Prioritize your time and avoid looking for quick shortcuts because actually they don’t really work. Look for worthwhile opportunities in your work. Below are some easy-to-follow tips that indicate how to design and create a comprehensive analytical report:
Step 1: Research The Problem
Sunday Adelaja said: “Maximize the time you have through hard work, concentration and research.” So, take your time and focus on researching the problem of your analysis work. In this method, you will know where to start in your analysis and concentrate on your main goals and objectives for your analytical report. Describe the problem by writing about its origin.
Step 2: Interpret Methods and Techniques
Use several data research tools such as searching and reading previous studies based on your main topic, interviewing different individuals and participants involved in your research problem, and many more. Then, list the techniques being applied to solve the problem, and interpret the efficiency from the solutions.
Step 3: Develop a Thorough Analysis
Then, develop a thorough analysis of your work according to the research methods you conducted earlier. So, look carefully on the success or failures of the solutions generated during the process. Make some clear assessments and comparisons based on the proposed solutions. Additionally, you can use some charts, graphs, tables, and other visual diagrams to demonstrate and clarify your analysis.
Step 4: Create Recommendations
Include some noteworthy recommendations and place these components at the last section of your analytical report. Adding this part will make your report trustworthy because it is based on data analysis, not from guessing or assumptions.
Step 5: Prepare the Final Draft
Draft your final analysis that provides systematic information about your report. You may also attach any supporting documents. Create a schedule for a meeting with your members along with the management, committee, investors, or corporate executives who will receive your analytical report.
Step 6: Edit or Revise the Report
The last important step of writing an analytical report is performing some necessary edits or revisions of your report. Ask your work colleagues and other professionals in your field concerning the quality and content of your analytical report so that you can submit your report in flying colors.
FAQs
Using a template for an analytical report is essential because it is an ultimate time-saving tool for your work. You don’t need to concentrate plenty of hours in structuring the layout, draft, and overall design of your report. It is actually a very no-hassle method as you can simply copy and paste the report template and customize it depending on your needs, preferences, and the guidelines from your boss or management.
Why is using an analytical report template essential?
When preparing your analytical report, you need to consider these fundamental elements such as a short thesis statement for the introduction, main discussion about the analysis, tangible evidence from various texts, data, facts or published journals to supplement the analysis, and citations and examples.
What are the fundamental elements of the analytical report?
Include comments and criticism from others, especially from the experts in your field. Begin your report with the most comprehensive details and dig deeper on the significant content. Also, you need to be ready to discern the perspective of your readers. And you need to develop a flexible outline.
How to write an effective analysis report?
Some examples of data analysis are text, descriptive, inferential, diagnostic, predictive, and prescriptive analysis. Descriptive analysis is the simplest form of analysis that makes a brief summary of the historical data with the use of dashboards. Diagnostic analysis is all about digging deeper and making detailed data. While predictive analysis is about applying the preceding data to make forecasts or predictions for the future.
What are some examples of data analysis?
The three steps of the data analysis process are evaluate, refine, and summarize.
What are the three steps of data analysis?
“Numbers have an important story to tell. They rely on you to give them a clear and convincing voice.” These words by Stephen Few can bring motivation and determination for you and other analysts so that all of you tell your stories in order to convey your data analysis and interpretations effectively. Usually, decisions are greatly influenced by emotion. However, when you use data which is based on logic and reasoning with the addition of emotion, it can create a powerful synergistic effect that can stimulate action according to your insights. So, writing a clear and in-depth analytical report for your business or research work is an effective tool in attaining your goals and aspirations as an analyst. By explaining all the fundamental points of your analysis, you fully communicate your vision to the management, executives and others in a systematic way. Before you let the sweet smell of success get in your head, please follow the aforementioned tips and steps here so that you are able to craft an excellently written analytical report. Plus, we recommend that you download our free analytical reports samples here right now!