13+ Sample Data Analysis Report
-

Business Data Analysis Report Template
download now -
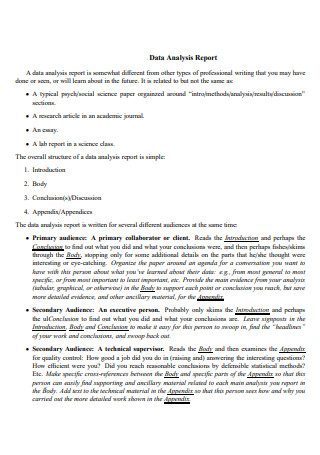
Data Analysis Report Template
download now -
Data Reporting Analyst Resume Template
download now -

Simple simple Data Analysis Report Template
download now -
Data Analysis Report Template
download now -
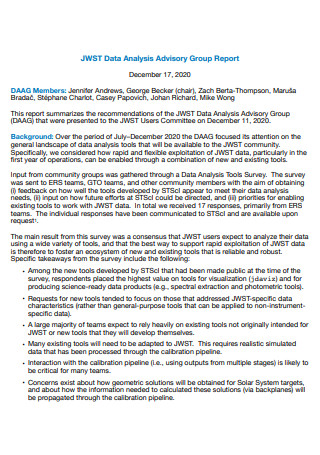
Data Analysis Advisory Group Report
download now -
Data Analysis Report Example
download now -
Data Analysis Final Report
download now -
Data Analysis Pilot Report
download now -
Data Analysis Report in PDF
download now -
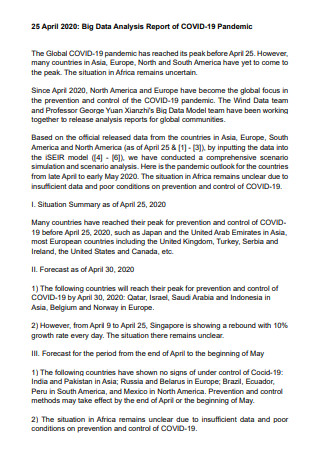
Covid-19 Data Analysis Report
download now -
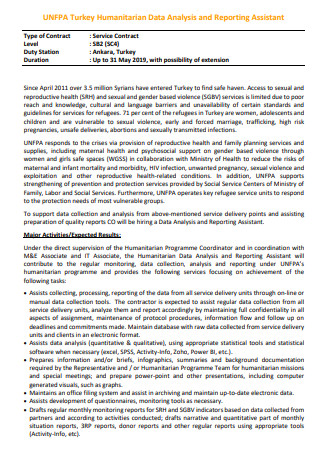
Data Analysis and Reporting Assistant
download now -
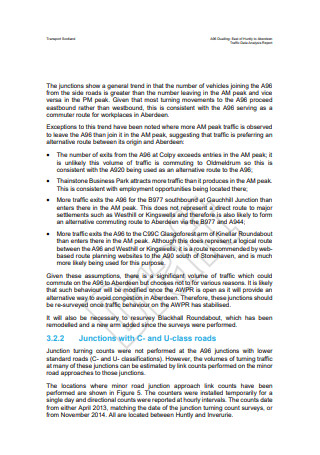
Traffic Data Analysis Report
download now -
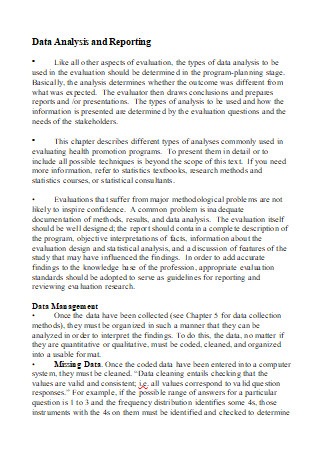
Data Analysis and Reporting in DOC
download now
FREE Data Analysis Report s to Download
13+ Sample Data Analysis Report
What Is a Data Analysis?
Benefits of a Data Analysis Report
Types of Data Analysis
How To Create a Data Analysis Report
FAQs
What is Data Analysis’s purpose?
What are the five fundamental techniques of statistical analysis?
What does it mean to have data analysis skills?
What Is a Data Analysis?
Analyzing, cleansing, manipulating, and modeling data to identify usable information, informing conclusions, and assist decision-making is data analysis. Data analysis has several dimensions and approaches, including a wide range of techniques under various titles and applied in multiple businesses, science, and social science sectors. Data analysis is essential in today’s business environment since it helps companies make more scientific decisions and run more efficiently. According to statistics, 53% of businesses embrace big data analytics, up from 17% in 2015, with the telecom and financial services industries leading the way.
Benefits of a Data Analysis Report
A data analysis report is beneficial to huge organizations with large volumes of data and to smaller firms that require insights to help them expand. Small organizations may face many of the same, if not more incredible, issues regarding data analysis. Consider the number of resources and capital available to a small business, nearly always far less than a large organization or corporation. It’s not just about having the right tools and software for data analysis, which is achieved through the formal gathering, processing, and application. You’ll also require access to analysts or scientists who are knowledgeable and experienced. You’ll need automation systems and processing solutions, as well as an organized environment to begin collecting data from sources. If interested, here are some of its other benefits:
Types of Data Analysis
Data analysis is a critical component of running a successful business. When data is used effectively, it enables a company to understand its past performance better and make more informed decisions about its future activities. There are numerous ways to utilize data at all levels of a business’s operations. There are four distinct types of data analysis used in all industries. While we categorize these, they are all connected and build upon one another. As you grow from simple to more complex analytics, the degree of difficulty and resources required increase. Simultaneously, the level of added insight and value boosts.
Descriptive Analysis
Descriptive Analysis is a type of data analysis that assists in describing, illustrating, or constructively summarizing data points for patterns to emerge that satisfy all of the data’s conditions. It is a critical step in conducting statistical data analysis. It provides a executive summary of your data’s distribution, assists in identifying typos and outliers, and enables you to identify similarities between variables, preparing you to conduct additional statistical analysis. Additionally, descriptive analytics enables businesses to use better the massive amounts of data they collect by segmenting it to focus on critical areas. It has evolved into a vital component of business operations because it enables stakeholders to comprehend their current state and compare it to the past. Without this subset of analytics, it would be impossible to forecast future trends and determine the optimal course of action. A more prominent analytics ecosystem component includes planning, diagnostic, predictive, and prescriptive analytics.
Diagnostic Analysis
The diagnostic analysis takes the descriptive analytics insights and drills down to the underlying causes of those outcomes. Organizations employ this type of analytics because it enables additional connections between data and the identification of behavioral patterns. A critical component of the diagnostic analysis is the generation of detailed data. When new issues arise, you may have already gathered some data reports on the subject. Having the data already in hand eliminates the need for duplicate work and connects all cases.
Predictive Analysis
The predictive analysis aims to provide an answer to the question, “what is likely to occur?” This type of analytics makes predictions about future events based on historical data. This is a step up from descriptive and diagnostic analyses. The predictive analysis makes logical predictions about the outcomes of events based on the summarized data. This analysis is based on statistical modeling, which forecasting requires additional technology and workforce planning. Also, it is critical to understand that forecasting is only an estimate; the accuracy of predictions is contingent upon the availability of high-quality, detailed data. While descriptive and diagnostic analysis is joint in business, many organizations run into trouble with predictive analysis.
Certain companies lack the human resources necessary to implement predictive analysis in every location. Others are unwilling or unable to invest in analysis teams across all departments or to educate existing teams. According to statistics, 60% of healthcare executives utilize predictive analytics within their organizations, and 20% of payers plan to within the following year. The annual survey surveyed 201 executives from payers and providers. The findings indicated that executive use of predictive analytics had increased since 2018 when 47% of executives showed they were using these tools.
Prescriptive Analysis
Although this final type of data analysis is the most desirable, few organizations are genuinely equipped to perform it. The prescriptive analysis is the cutting edge of data analysis, combining insights from previous studies to determine the best course of action to respond to a current problem or decision. The prescriptive analysis makes use of cutting-edge technology and data management practices. It is a significant organizational commitment, and businesses must ensure that they are prepared and willing to make the necessary effort and investment.
How To Create a Data Analysis Report
Every data project necessitates the presentation of findings in a readable data analysis report. This is a challenging exercise for some. After all, the primary purpose of a technical report is to convey information. If the material were simple to understand, however, it would be unlikely to require lengthy inquiry. In these circumstances, it’s simple to see why even the most seasoned business professionals find reporting scary. However, reporting, like any other skill, improves with practice. We’ll go through five steps to help you create a data analysis report in the section below.
Step 1: Collect the information.
Before you begin creating the report, you must gather all of the data included in it. Include every detail essential in the analysis for the improvement and growth of your business. A data analysis report can assist you in gaining the necessary insights into the changes that can be implemented in your workplace.
Step 2: Objectives and Goals
Bear in mind that you must first determine the report’s purpose. You must understand why you are creating an analysis report in the first place to create a list of smart goals and objectives to accomplish. Your goals and objectives should be completed within a specified time frame. As such, ensure that you include a timeline chart alongside the details of your plans in the report.
Step 3: Recognize Your Audience
It would help if you first chose your intended audience. This will make it easy for you to judge and determine the type of report you should write for them. Your report should be organized so that your viewers can easily read what they need to read. Understand your audience to determine what you can create for them. Keep them in mind and think like them to gain a deeper understanding of their needs and desires.
Step 4: SWOT Analysis
SWOT analysis may help you identify your internal strengths and weaknesses, as well as your external opportunities and dangers. This is something you should do for your company as well. In this manner, you can easily keep track of your staff and your company’s SWOT analysis. Include an executive summary and a simple synopsis in the report so that the reader has a quick overview of the topic. Also, SWOT analysis is a term that refers to the strengths, weaknesses, opportunities, and threats. A SWOT analysis is critical for strategic planning because it identifies the necessary internal and external forces that contributed to your company’s current position and favor or obstructs your efforts to move it to where you want it to be.
Step 5: Edit and revise
After compiling all of the points in your report, you must revise and recheck it for errors. Make necessary adjustments wherever and whenever required. Editing the report before submitting it to your superiors is critical, as you do not want them to point out your errors. As a result, ensure that you thoroughly check the report for errors. Visual aids are critical to the comprehension of a report. Therefore, ensure that you have the necessary ones that capture the audience’s attention and hold it until they finish reading the report.
FAQs
What is Data Analysis’s purpose?
Data analysis is the process of transforming and modeling data to uncover helpful information for business decision-making. The purpose of data analysis is to gather useful information and make informed decisions based on the findings. This assists in conducting an accurate analysis of the business, resulting in more informed decisions.
What are the five fundamental techniques of statistical analysis?
It all comes down to applying the appropriate statistical analysis techniques, which are how we process and collect data samples to uncover patterns and trends. This analysis has five possible outcomes: mean, standard deviation, regression, hypothesis testing, and sample size determination.
What does it mean to have data analysis skills?
A data analyst is a person who examines data and reports findings using technical skills. A data analyst might utilize SQL skills to collect data from a company database, then use programming abilities to analyze that data before reporting their findings to a larger audience on a typical day.
To begin, you can utilize any of the data analysis mentioned previously in this article. They will undoubtedly assist you in preparing the necessary report. The report you write must be credible and original, as it contains vital information. The data analysis report templates function similarly to pre-fabricated data analysis report forms, providing you with a consistent framework for creating an appropriate data analysis report. Numerous websites on the internet offer these templates, and many do so for free. For additional information, consult online spreadsheet analysis templates. Additionally, you will be able to customize these templates based on your typical data analysis requirements.