18+ Sample Timeline Chart
-
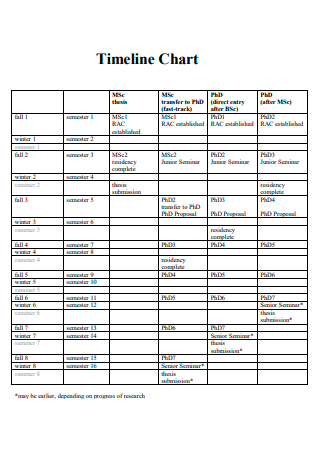
Timeline Chart Template
download now -
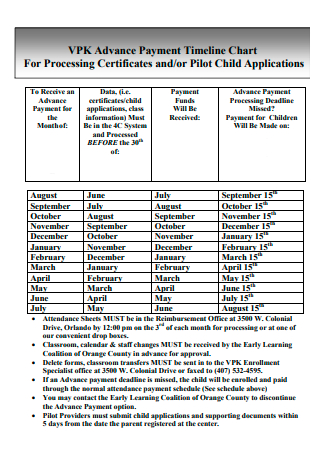
Advance Payment Timeline Chart
download now -
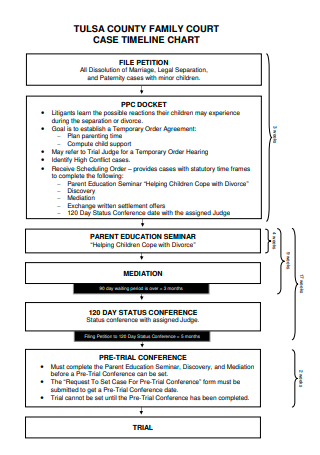
Case Timeline Chart
download now -
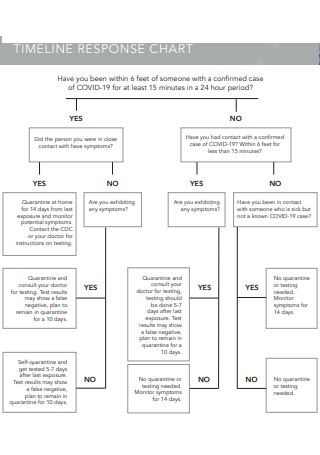
Timeline Response Chart
download now -
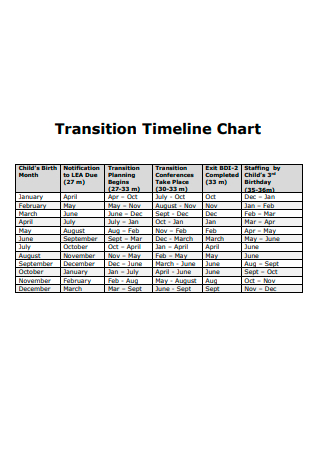
Transition Timeline Chart
download now -
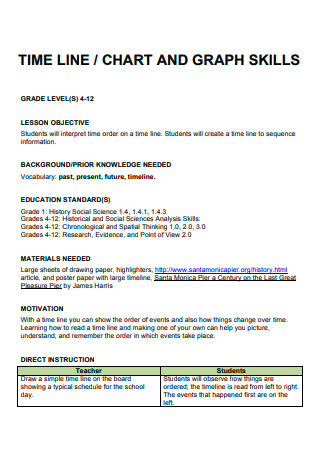
Timeline Chart and Graph Skills
download now -
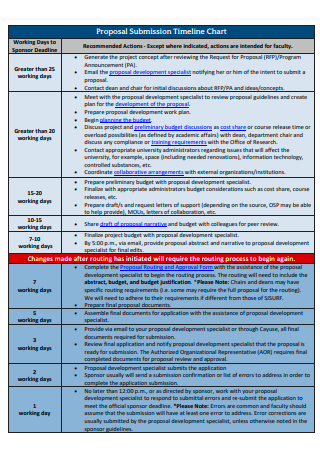
Proposal Submission Timeline Chart
download now -
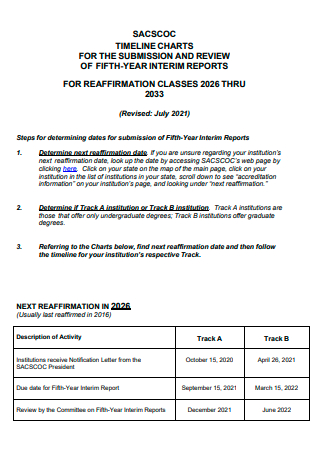
Timeline Chart in PDF
download now -
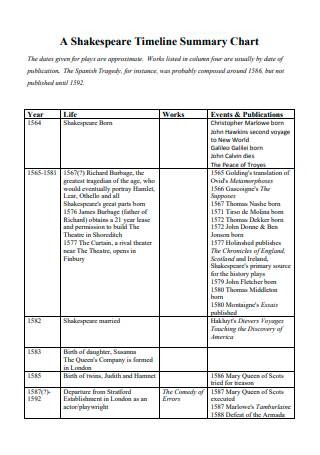
Timeline Summary Chart
download now -
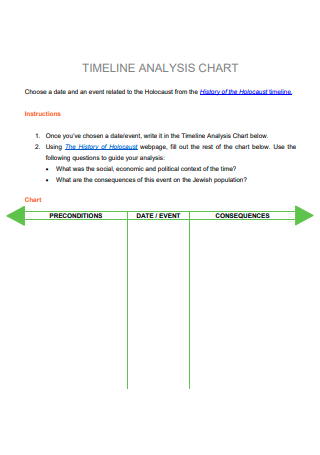
Timeline Analysis Chart
download now -
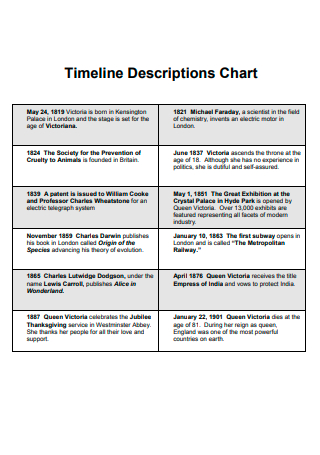
Timeline Descriptions Chart
download now -
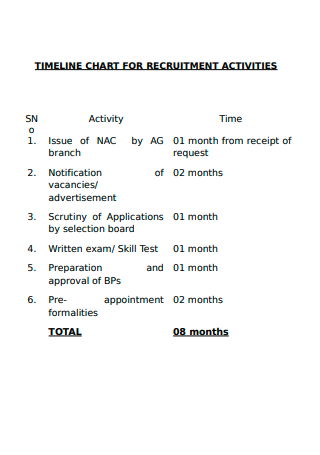
Timeline Chart For Recruitment Activities
download now -
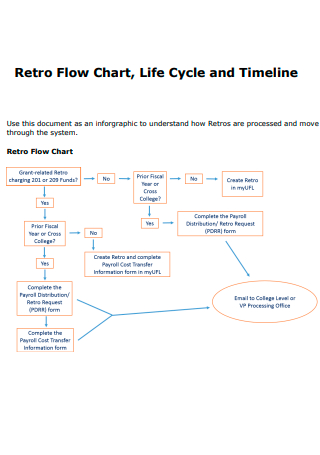
Timeline Retro Flow Chart
download now -
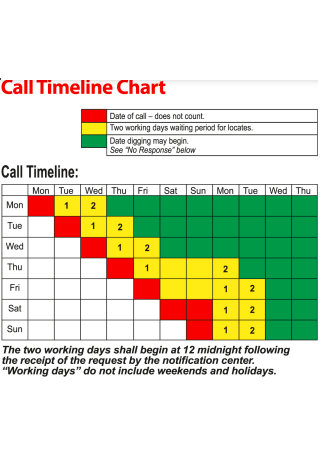
Call Timeline Chart
download now -
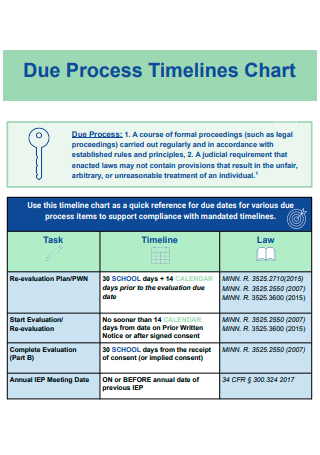
Due Process Timeline Chart
download now -
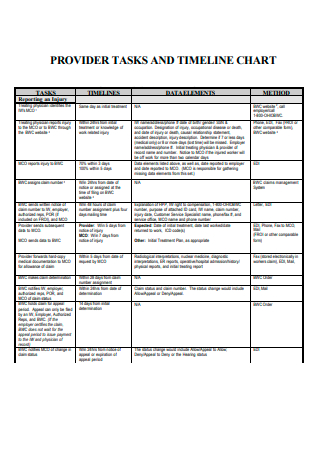
Provider Tasks and Timeline Chart
download now -
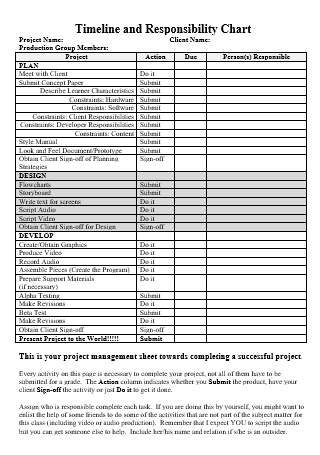
Timeline and Responsibility Chart
download now -
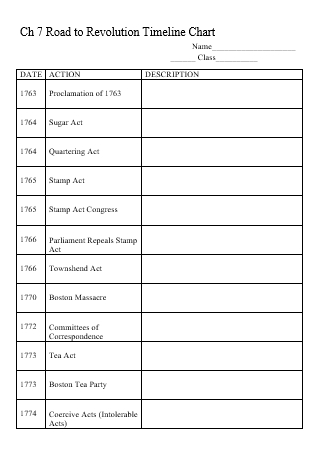
Road to Revolution Timeline Chart
download now -
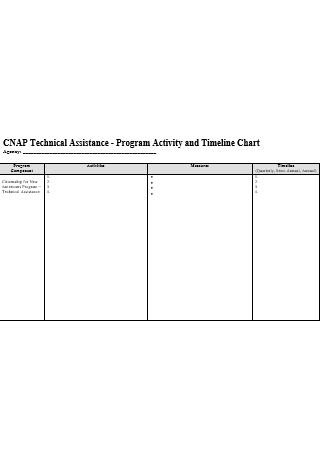
Program Activity and Timeline Chart
download now
FREE Timeline Chart s to Download
18+ Sample Timeline Chart
What is a Timeline Chart?
Why is Creating a Timeline Chart Important?
What Are The Other Benefits of a Timeline Chart?
What Are The Various Types of Timelines?
How to Make an Effective Timeline Chart
FAQs
What are the important elements in a timeline chart?
Are there any tips to keep in mind when making a timeline chart?
Can you use software when creating a timeline chart?
What is a Timeline Chart?
A timeline chart is defined as a tool that serves as a rendition of a series of events in chronological order. It can be created for any event or a project that occurred during a given period of time. Having this type of data visualization can help you better understand the order of historical events and any critical milestones of a given project. It can also help you understand why a single task can take so long to accomplish. A timeline chart also helps a company identify who is working on a specific project and when it is being worked on. These charts are usually presented horizontally and they mark units of time, important events, tasks, and activities from left to right. And since timeline charts always document every step in the process of a task or project, potential problems and shortcomings can be avoided.
Why is Creating a Timeline Chart Important?
In the instances where an individual or a company wants to see important events or keep track of milestones across a period of time, using a timeline chart might be helpful. A timeline chart might be created by someone who is planning their year’s goals or keeping track of their progress toward those goals. One of the most popular areas to discover timelines is in the workplace, where they can help teams stay focused and accomplish the company’s milestones on time.
An example of a situation that calls for a timeline chart to be created might be when a company plans to start a new project. In this situation, managers or team leaders can create timeline charts that can show when certain parts of the project being undertaken must be completed. These timeline charts can then be used by the managers to delegate work to their employees, thereby resulting in a more effective workflow and making them collaborate in order to finish the project on time or earlier. Maintaining self-accountability and showing progress are other uses of timeline charts in the workplace.
What Are The Other Benefits of a Timeline Chart?
Timeline charts serve more than being just a visual representation of the scope of a project. They also encourage transparency and team accountability by making sure what needs to be done and when it needs to be done. Here are the other benefits that using a timeline chart can give:
- It helps you gain a better understanding of your visual development because a timeline chart is a simple, straightforward, and intuitive method of tracking your progress and predicting future events.
- It enables better collaboration by keeping everyone in your team up to date on the progress of a project, the workload, and its key changes.
- It enables fewer bottlenecks and resource overload because a timeline chart identifies possible delays or issues before they snowball and get worse over time.
- It improves an individual or a company’s way of managing time since gives them a better understanding of their activities and lets them schedule the said activities accordingly.
What Are The Various Types of Timelines?
Here are some of the different types of timelines that a company can utilize when planning for a project:
How to Make an Effective Timeline Chart
Making an effective timeline chart is not so difficult as you might expect. It involves a few steps. A timeline chart is usually easy to customize or change to tailor to your specific needs. With that being said, here are the steps of an effective timeline chart, whether done by hand or by software:
1. Identify the purpose and choose an event or process that you want to represent in the timeline chart.
In this step, you can start by thinking about what you want your timeline to achieve. Identify the specific goals and objectives that you need to consider when brainstorming or visually presenting your data. In choosing an event that you want to represent in the timeline, you can organize a meeting between your team. In this step, you can just focus on coming up with the important events that relate to every stage of your project.
2. Take the materials you need and start creating the frame of the timeline.
The materials you will need in creating the timeline depend on whether you want to make the timeline chart manually or by the use of software. When you choose to do it by hand, a pencil and paper are usually ideal for quick and easy timelines. Poster boards and markers are usually handy when you make a timeline for bigger projects and ideas. When you choose to do it by software, prepare the software of your choice, such as Microsoft Word, and open it. After the materials have been prepared for manual and digital work, you can now begin creating the frame of your timeline chart.
3. Identify your start and finish dates and place your tasks in chronological order.
In this step, begin identifying the start and finish dates for your timeline chart, all depending on the project that you have chosen. Then, identify the milestone dates of your project. Once everything is done, begin placing them on the timeline chart at equal intervals along the line.
4. Place the activities in chronological order along with explanations.
Once you have done placing the dates and constructing the frame of the timeline chart, it is now time to place your activities in the timeline chart. Keep in mind that the activities should follow a logical sequence. You can think of the chronological sequence that your activities should be following and assign them to a specific date in the timeline chart. Afterwards, you can provide a brief explanation of how the activities should be done with efficiency and how they should be finished on time.
5. Customize and verify the timeline chart.
Once you’re done creating the structure of your timeline chart, don’t be afraid to give it a good customization work. You can make use of different colors, shapes, and borders to customize the timeline. This helps it differentiate the information for readers and make it more engaging for them to read. However, it is also important to avoid overdoing the customization on your timeline chart. Overdone custom work on your timeline can prove to be a distraction for the readers instead of making it easier to read. Once you’re confident of your timeline chart, give it a second look to find some overlooked mistakes such as typographical errors and inconsistent elements in the timeline chart.
FAQs
What are the important elements in a timeline chart?
Here are the 4 elements that make up a simple timeline chart:
- Tasks – These refer to the activities that you will be representing in your timeline chart.
- Task duration – This refers to the time that is needed in completing each task that is in the timeline chart.
- Milestones – This refers to any significant achievement or event in the project.
- Colors and Shapes – These elements of the timeline chart are just optional. However, when properly done, they can help in making a timeline chart more visually appealing and easier to understand.
Are there any tips to keep in mind when making a timeline chart?
In making a timeline chart, it is important that you consider choosing a theme. This is done in order to aid you in selecting the activities that you need to include in the timeline. You should also tell a story of some sort whenever you’re making the timeline chart. This means that each item in your timeline should flow and have a connection between one item and the next and should tell a narrative to those who are viewing your timeline chart.
Can you use software when creating a timeline chart?
As stated earlier in this article, yes, you can make use of software when making your timeline chart. It can be encouraged since software can provide you with a polished and professionally finished product. There are many sorts of software that are capable of creating a timeline chart. You can also even make use of a simple document or spreadsheet software to do the job, although you will have to select an appropriate template for the theme or the project that you are going for.
Having an effective timeline chart will help you oversee your entire project and visualize its progress at a quick look. It is a really useful tool for students, small businesses, or large organizations to help them visualize events, whether it is major or minor. When you have everything you need, a timeline chart can be relatively easy to create. Should you need a reference to look at when you end up needing to make one, this article has plenty of examples provided above.