Financial Report Samples
-
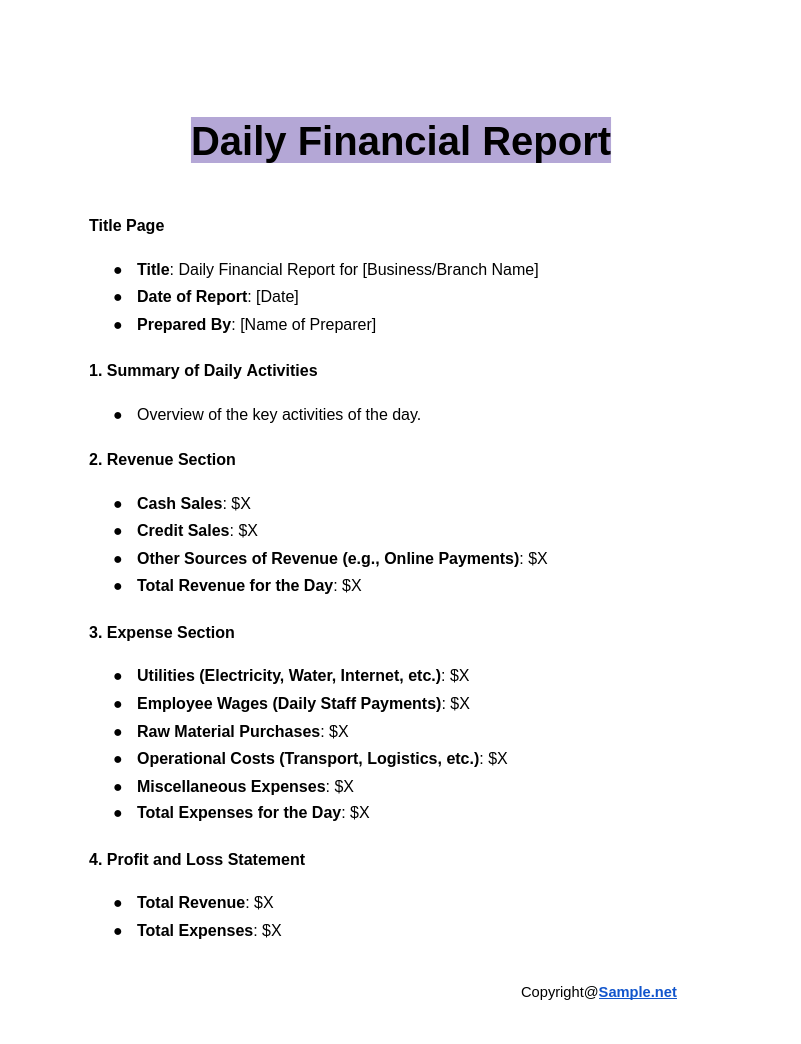
Daily Financial Report
download now -
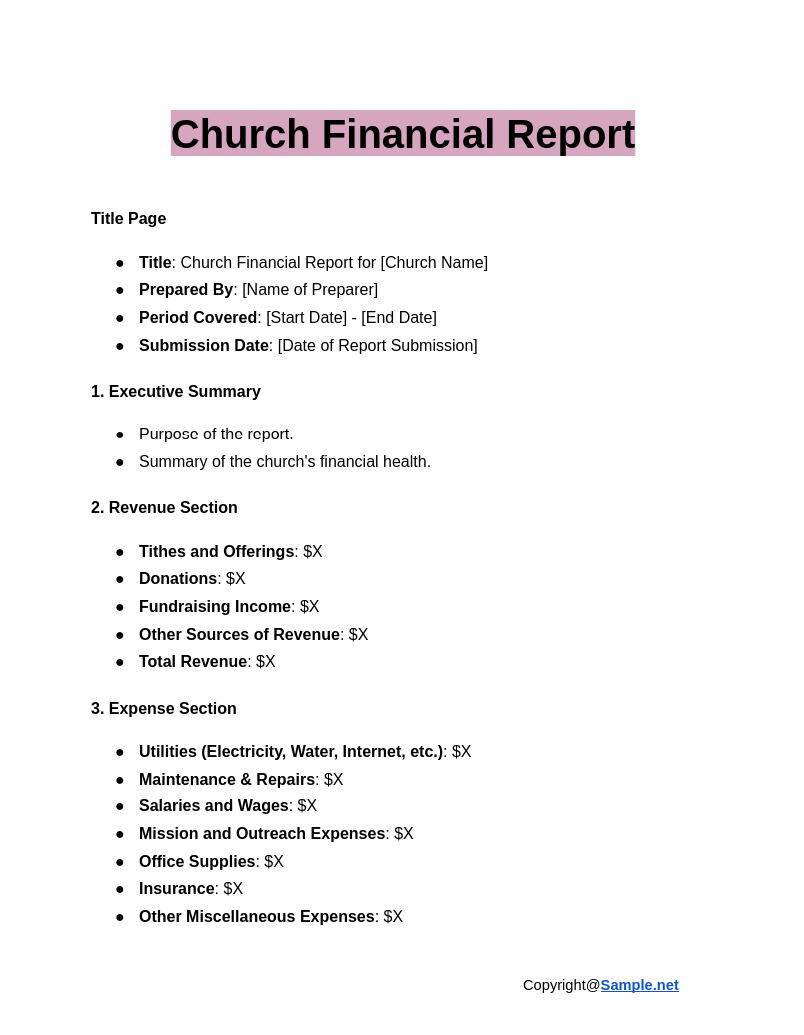
Church Financial Report
download now -
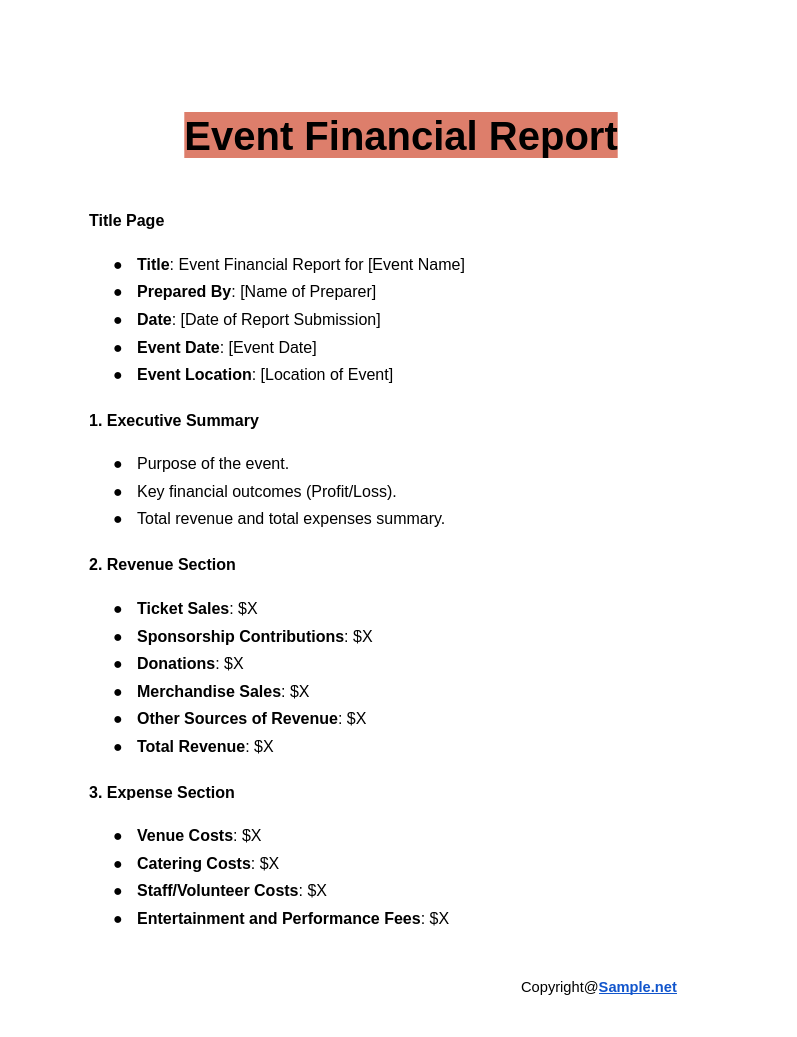
Event Financial Report
download now -
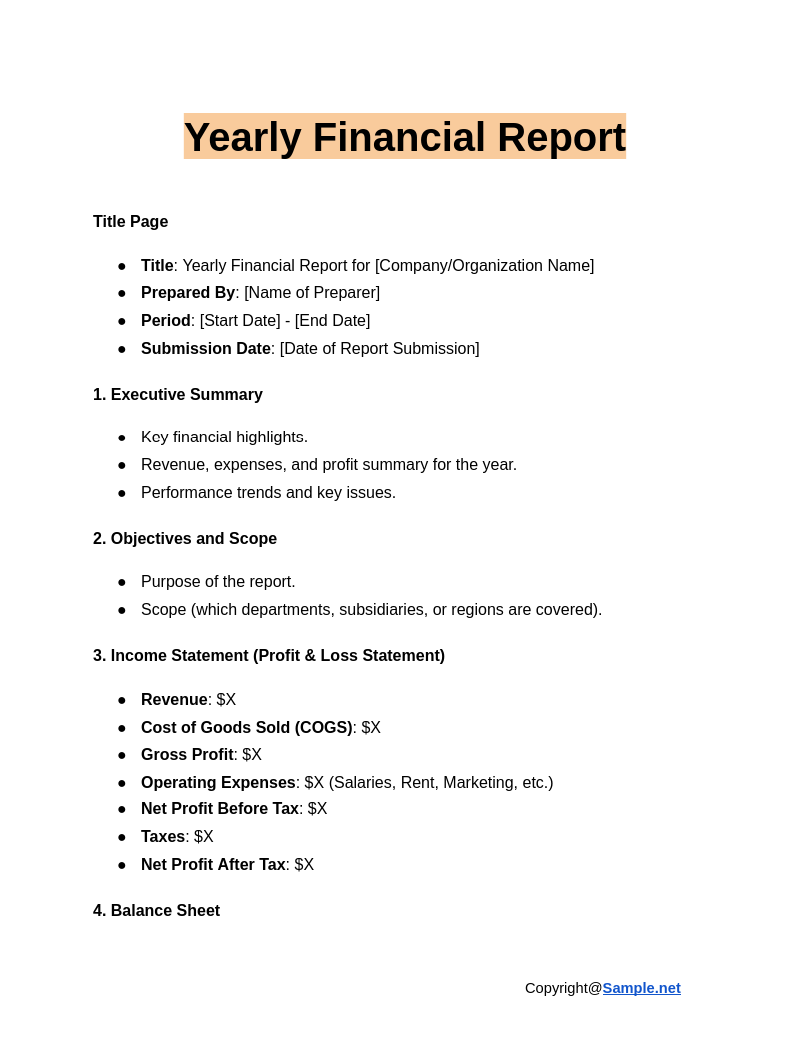
Yearly Financial Report
download now -
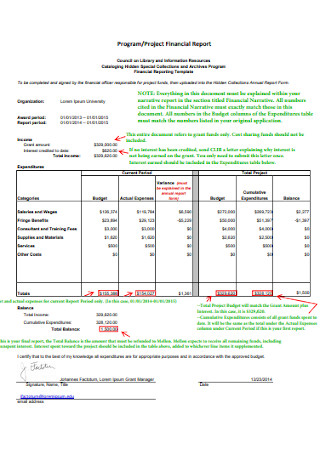
Project Financial Report
download now -
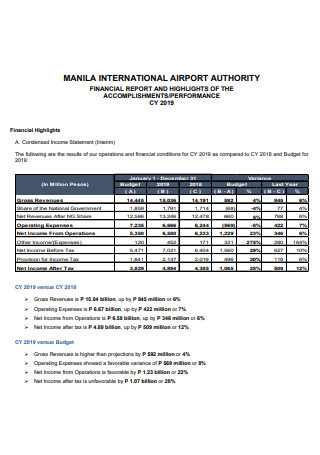
Airport Accomplishment Financial Report
download now -
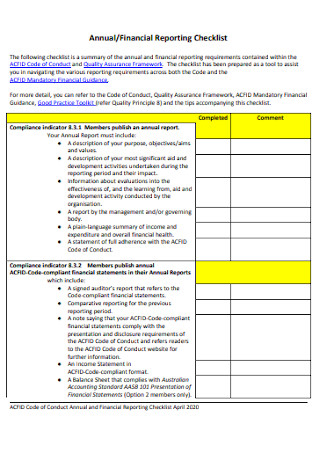
Annual Financial Report Checklist
download now -
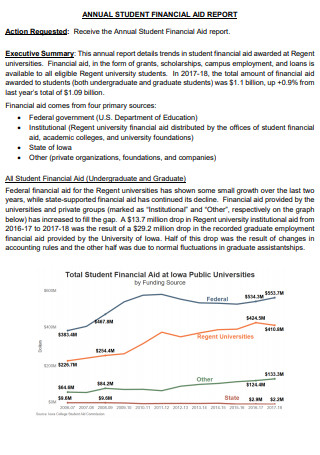
Annual Student Financial Report
download now -
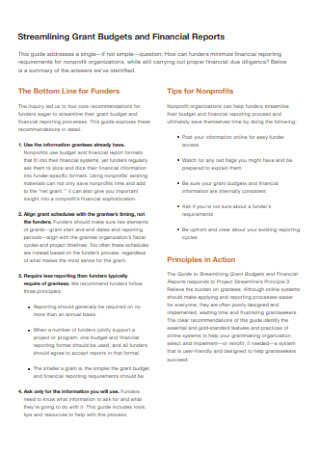
Grant Budget and Financial Report
download now -
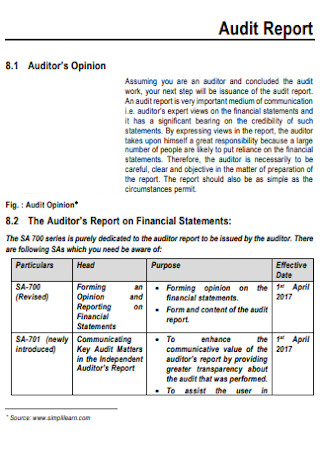
Financial Audit Report
download now -

Popular Annual Financial Report
download now -
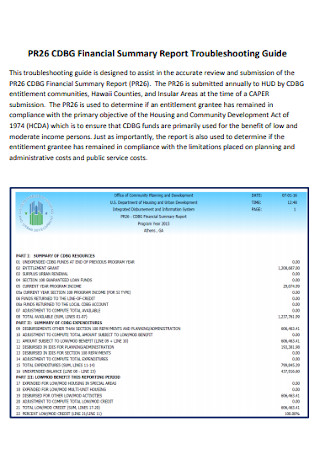
Financial Summary Report
download now -
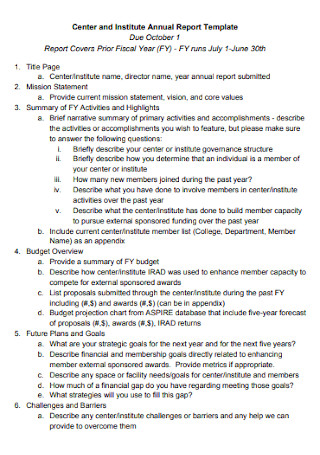
Institute Annual Report
download now -
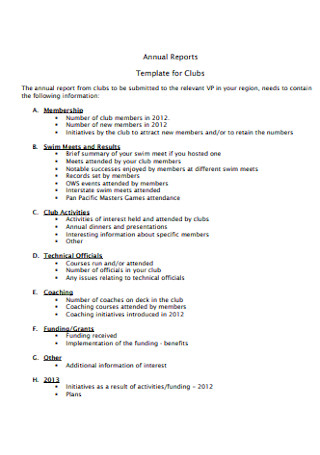
Annual Report for Clubs
download now -
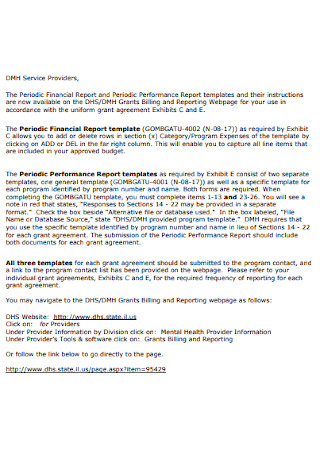
Periodic Financial Report Template
download now -
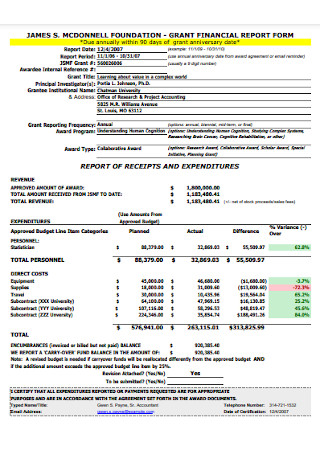
Grant Financial Report Form
download now -
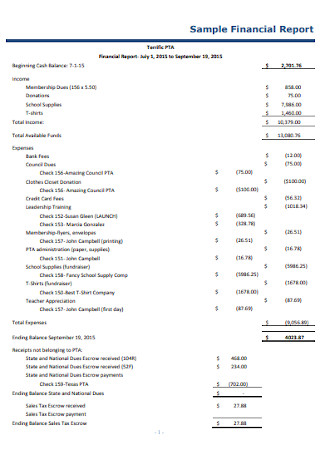
Sample Financial Report Example
download now -
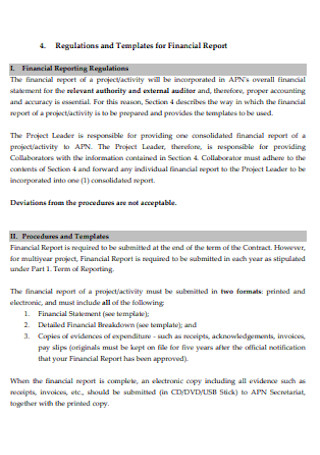
Regulation for Financial Report
download now -
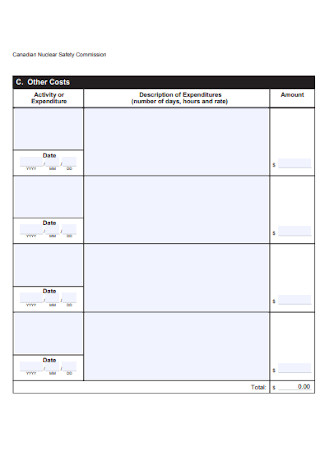
Final Financial Report Template
download now -
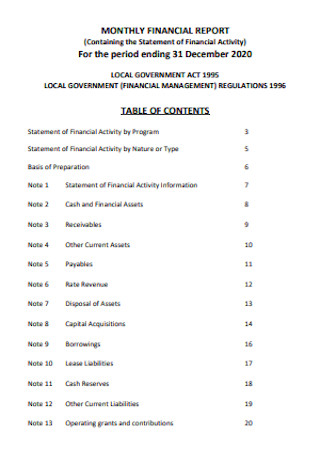
Monthly Financial Report Template
download now -
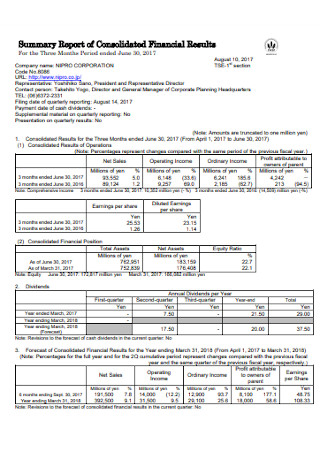
Report on Consolidated Financial Results
download now -
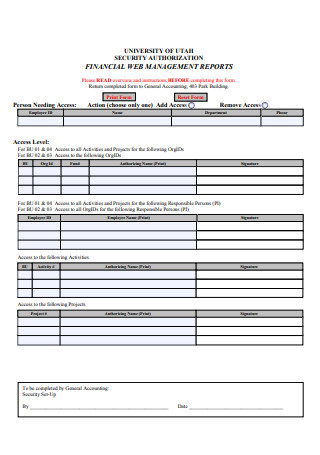
Financial Web Management Report
download now -
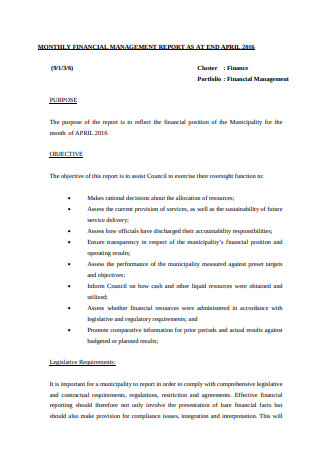
Monthly Financial Report
download now -
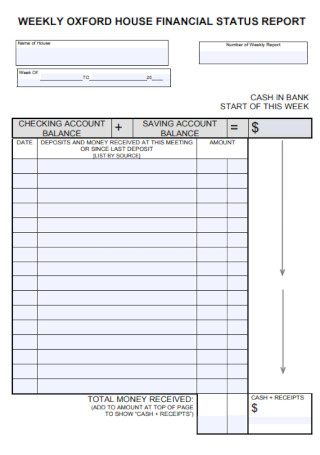
House Financial Status Report
download now -
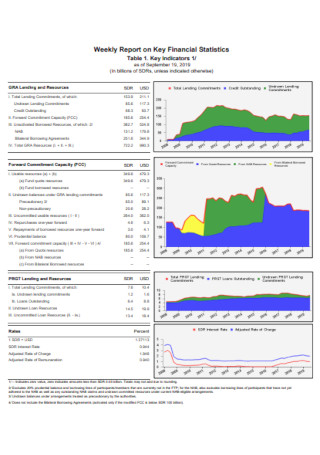
Weekly Report on Financial Statistical
download now -
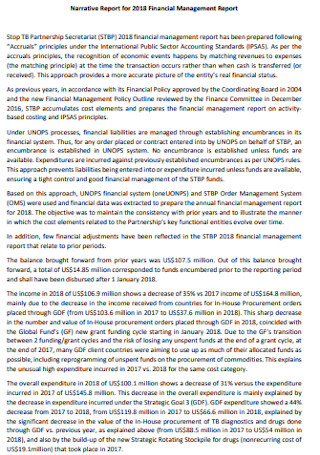
Financial Management Narrative Report
download now -
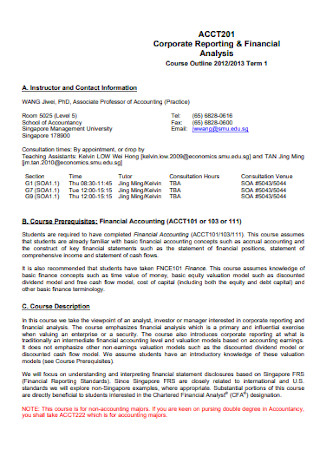
Corporate Financial Report
download now -
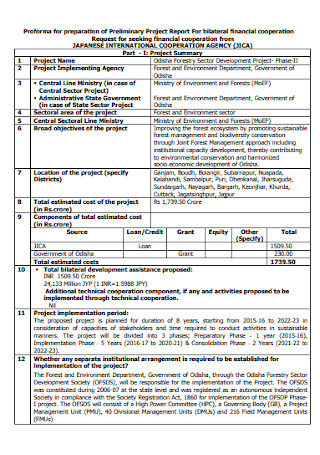
Preliminary Project Financial Report
download now
FREE Financial Report s to Download
Financial Report Format
Financial Report Samples
What is a Financial Report?
Benefits of Financial Reports
How to Create a Financial Report
FAQs
What is financial reporting’s primary goal?
When it comes to financial statements and financial reporting, what’s the difference?
What is the difference between GAAP and International Financial Reporting Standards (IFRS)?
What is the difference between an income statement and a balance sheet?
What is the role of GAAP and IFRS in financial reporting?
What is the significance of cash flow in a financial report?
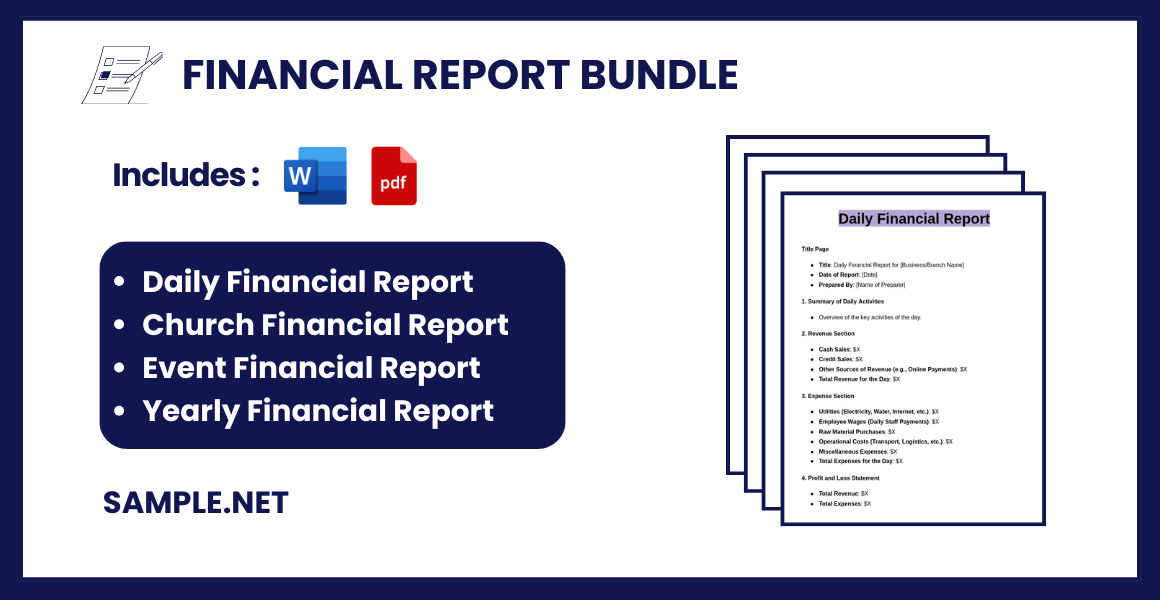
Download Financial Report Bundle
Financial Report Format
1. Title Page
- Report Title: Financial Report for [Company Name]
- Prepared By: [Name of the Preparer/Department]
- Date: [Date of Report Submission]
- Period Covered: [Start Date] to [End Date]
- Confidentiality Statement: (Optional) “This report is confidential and intended for authorized personnel only.”
2. Table of Contents
- Executive Summary
- Objectives of the Report
- Scope and Period of the Report
- Methodology Used
- Key Findings
- Financial Statements
- Income Statement (Profit & Loss Statement)
- Balance Sheet
- Cash Flow Statement
- Statement of Changes in Equity
- Analysis and Interpretations
- Key Financial Ratios
- Trend Analysis
- Variance Analysis
- Recommendations
- Appendices (if any)
- Glossary of Terms (Optional)
3. Executive Summary
- Brief overview of financial performance.
- Key financial highlights, trends, or concerns.
- Summarize changes from previous periods.
- Focus on significant changes in revenue, profit, expenses, or key financial metrics.
4. Objectives of the Report
- State the purpose of the report (e.g., provide stakeholders with a clear picture of the financial health of the company, analyze business growth, or assess profitability).
- Link objectives to decision-making needs.
5. Scope and Period of the Report
- Define the scope of the financial report (e.g., for a specific business unit, department, or whole organization).
- State the reporting period (e.g., Q1 2024, Fiscal Year 2024, etc.).
6. Methodology Used
- Mention the accounting standards used (e.g., IFRS, GAAP, etc.).
- Indicate any specific methodologies for financial analysis, such as historical trend analysis, ratio analysis, etc.
- State any changes in accounting practices.
7. Key Findings
- Highlight the most critical findings from the report.
- Mention performance drivers (e.g., changes in costs, revenue streams, or operational efficiencies).
- List major risks or issues discovered (if any).
8. Financial Statements
A. Income Statement (Profit & Loss Statement)
- Revenue (Sales, Service Income, Other Operating Income)
- Cost of Goods Sold (COGS)
- Gross Profit (Revenue – COGS)
- Operating Expenses (Salaries, Rent, Utilities, Marketing, Depreciation, etc.)
- Operating Profit (EBIT) (Gross Profit – Operating Expenses)
- Other Income/Expenses (Interest, Dividends, Miscellaneous Income)
- Net Profit Before Tax
- Taxes (Provision for Income Taxes)
- Net Profit After Tax (Net Income)
B. Balance Sheet
- Assets
- Current Assets (Cash, Accounts Receivable, Inventory, Prepaid Expenses)
- Non-Current Assets (Property, Plant & Equipment, Intangible Assets, Long-Term Investments)
- Liabilities
- Current Liabilities (Accounts Payable, Short-Term Loans, Accrued Expenses)
- Non-Current Liabilities (Long-Term Debt, Deferred Tax Liabilities)
- Equity
- Share Capital
- Retained Earnings
- Reserves & Surplus
- Total Equity (Assets – Liabilities)
C. Cash Flow Statement
- Cash Flow from Operating Activities
- Net Cash from Operations (Net Income + Non-Cash Expenses – Changes in Working Capital)
- Cash Flow from Investing Activities
- Purchases/Sales of Equipment, Investments, Intangible Assets
- Cash Flow from Financing Activities
- Loan Payments, New Loan Proceeds, Issuance of Shares, Dividends Paid
- Net Cash Flow (Increase/Decrease)
- Cash at Beginning of Period
- Cash at End of Period
D. Statement of Changes in Equity
- Opening balance of equity at the start of the period.
- Additions (profit, revaluation gains, issuance of new shares, etc.).
- Subtractions (dividends, buyback of shares, losses, etc.).
- Closing balance of equity at the end of the period.
9. Analysis and Interpretations
A. Key Financial Ratios
- Profitability Ratios (Net Profit Margin, Gross Profit Margin, Return on Equity (ROE), Return on Assets (ROA))
- Liquidity Ratios (Current Ratio, Quick Ratio)
- Leverage Ratios (Debt-to-Equity Ratio, Interest Coverage Ratio)
- Efficiency Ratios (Asset Turnover Ratio, Inventory Turnover Ratio)
B. Trend Analysis
- Compare current performance with previous periods (month-to-month, quarter-to-quarter, or year-on-year analysis).
- Use visual aids like line charts or bar graphs to present trends in revenue, profit, cash flow, etc.
C. Variance Analysis
- Show variances between budgeted/forecasted figures and actual figures.
- Explain significant deviations and the reasons for them (e.g., cost overruns, reduced sales, etc.).
10. Recommendations
- Provide actionable recommendations based on analysis.
- Examples:
- Cost-cutting initiatives.
- Revenue generation strategies.
- Areas for process improvements.
- Investment opportunities.
11. Appendices
- Include supporting documents, charts, or tables that add value to the report.
- Attach any additional analysis, raw data, or technical references that support the report’s key findings.
12. Glossary of Terms
- Define key financial terms used in the report (especially useful for stakeholders unfamiliar with financial jargon).
- Examples: EBITDA, Working Capital, ROI, Depreciation, Amortization, etc.
What is a Financial Report?
A financial report is a formal document that details an organization’s financial status over a specific period. It summarizes revenues, expenses, assets, liabilities, and equity. Companies use financial reports to evaluate profitability, track cash flow, and comply with legal and regulatory requirements. Investors, management, and external stakeholders rely on these reports to make informed financial decisions. The reports help in identifying financial trends, risks, and growth opportunities essential for strategic planning and investment. You can also see more on Annual Reports.
Benefits of Financial Reports
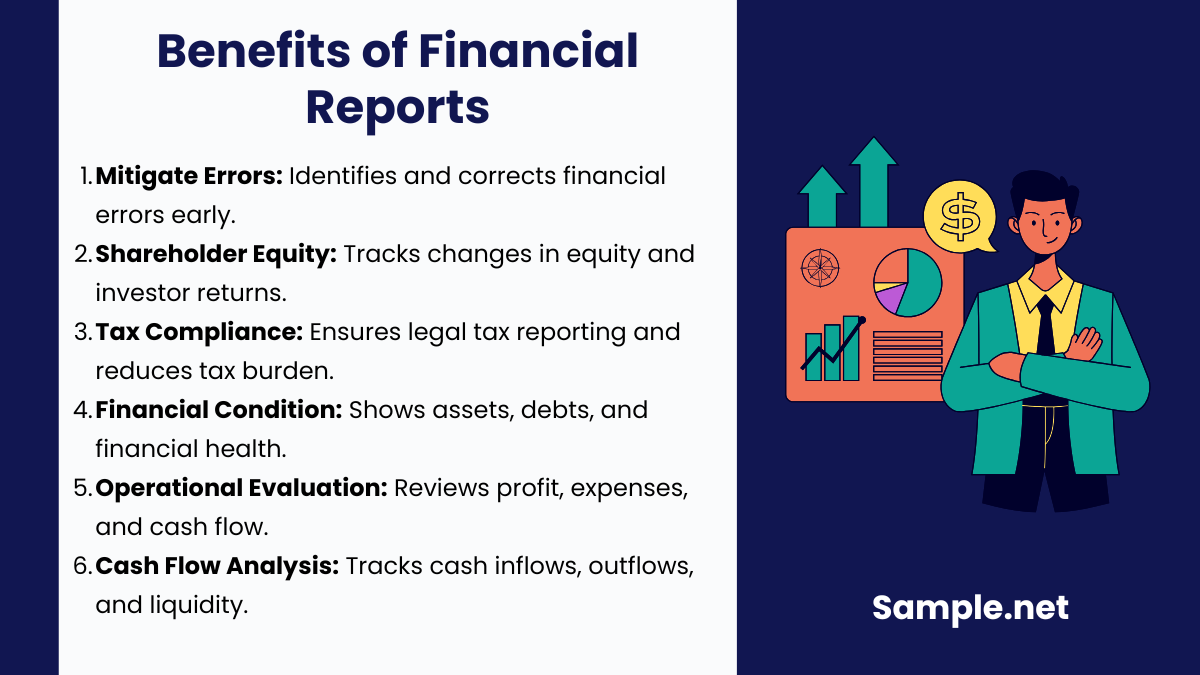
Financial statements include a means of information that can be used by investors, creditors, and analysts to evaluate a company’s economic performance. Numerous financial data points in financial reports are required by law or accounting standards. Financial reporting enables management to communicate the company’s past accomplishments and future objectives. Several reasons why financial reporting is beneficial to your business include the following:
1. Mitigate Errors
Accurate financial reporting can assist businesses in identifying costly errors and inter-process errors early in the process. There is no more effective method of detecting illegal economic activity than by examining financial statement discrepancies. Mistakes can be discovered through a reconciliation process. Businesses spend considerable time reconciling their accounts and verifying each journal entry to determine whether an accounting error occurred or if any part of the business has been tampered with.
2. Shareholder Equity is Shared
For equity investors, the disclosure of shareholders’ equity is crucial. It depicts the changes in various equity components, such as retained earnings over time. Shareholder equity is a company’s net worth, equal to its total assets, fewer liabilities. Increased investment returns for current equity shareholders are achieved when a company’s equity grows steadily due to increase retained earnings rather than extending its shareholder base.
3. Tax Purposes
The most compelling argument for using financial reports is that you must and are obligated to do so by law. These reports are used by the Internal Revenue Service to ensure that you are paying your fair share of taxes. Businesses that generate a lot of revenue must spend a lot of taxes. Accurate financial reporting assists them in lowering their tax burden and ensuring that all of their resources are not drained in a short time. You can also see more on Annual Business Reports.
4. Demonstrates Financial Condition
Before investing, potential investors want to know how well the company is performing. The financial reporting of a firm is used by investors, creditors, and other capital providers to assess the safety and profitability of their investments. Stakeholders are curious about where their money has gone and where it is presently. The balance sheet address, for example, provides precise information on the company’s asset list investments as well as outstanding debt and stock components. This information can help creditors and investors better understand the company’s financial status and capital mix.
5. Operational Evaluation
A balance sheet does not indicate what operational changes may affect a company’s financial condition. Investors should also consider the period’s operating results. An income statement summarizes the results of sales, expenses, and profit or loss. Investors can use the income statement to assess a company’s past income performance as well as its future cash flow.
6. Cash Flow Analysis
The income statement reports a company’s profitability but provides no direct information on the company’s cash flow. Non-operating activities, such as investing and financing, result in cash inflows and outflows for a company over time. Investors are paid back with cash from all sources, not revenue from activities. As a result, a cash flow statement is crucial for an investor to examine. The cash flow statement depicts the flow of funds between the company and outside contractors over some time. Investors can tell if a firm has adequate cash to cover expenses and acquisitions by looking at this statement. You can also see more on End of Year Report.
How to Create a Financial Report
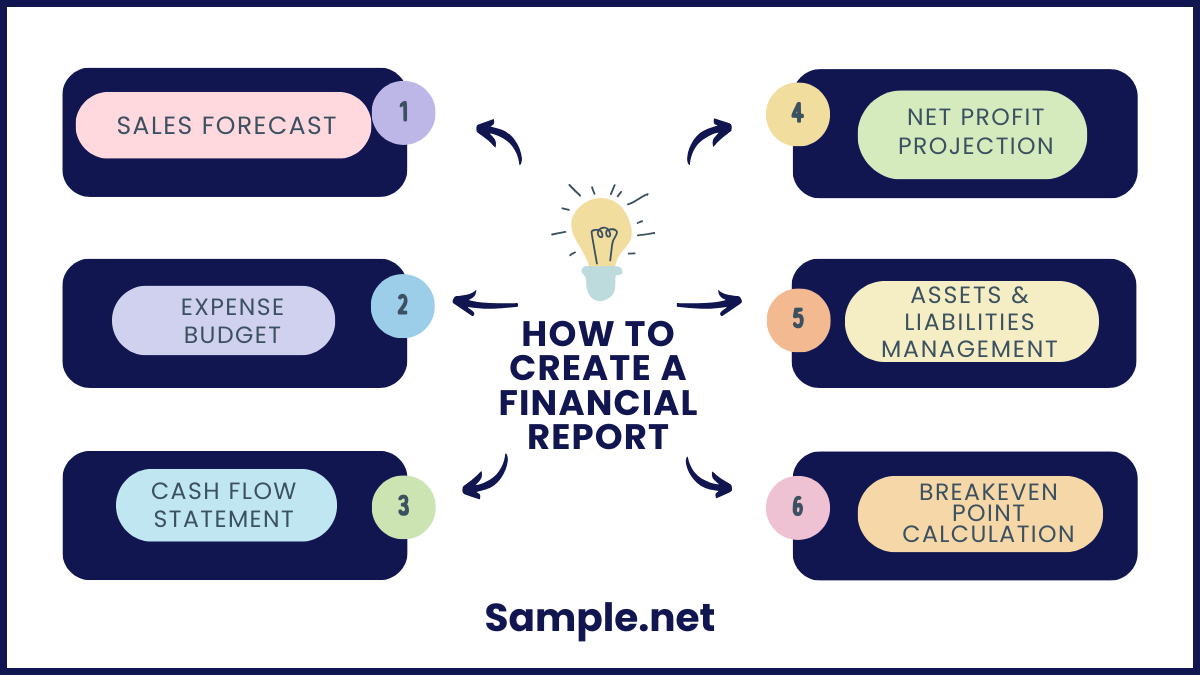
The vision of your firm from today to the future is known as business planning or forecasting. The financials in a company plan are not calculated in the same manner that the details in your accounting reports are calculated. The financial part of your company plan has two goals. First and foremost, potential investors, venture capitalists, angel investors, and anybody else with a financial stake in your company will require this information. The second, and maybe most essential, aim of the financial component of your business plan is for your benefit, so you can forecast how your company will perform. With this, here are some steps in creating a Financial Report.
Step 1: Construct A Sales Forecast
Make a spreadsheet that forecasts your sales for the next three years. Set up distinct sections for different lines of business and columns for each month of the first year, then quarterly for the second and third years. It will help if you create spreadsheet blocks that contain one for unit sales, one for pricing, and a third for calculating the cost of sales by multiplying units by unit cost. Because you want to compute the gross margin, you include the cost of sales in your sales estimate.
Step 2: Create An Expense Budget
You must know how big it will cost you to make the sales that you have anticipated. When making your monthly budget, keep in mind your fixed costs (such as rent and salary) and your variable costs (such as most advertising and promotional spending). You’ll have to estimate things like interest and taxes with a lot of these numbers. Calculate taxes, multiply your projected profits by your best-guess tax percentage rate, and multiply your estimated loan balance by an estimated interest rate.
Step 3: Create a cash-flow statement.
This is a statement that displays how much money is coming in and going out of your company. Your cash flow statement is based in part on sales projections, balance sheet items, and other assumptions. Historical financial statements should be available for existing businesses to help in projecting cash flow. Beginning with a 12-month cash flow statement, new firms should launch their cash flow. It is critical to understand how you will invoice to obtain these forecasts. Will you expect payment straight away or within 30 to 90 days from your customers? You don’t want to be surprised if you only collect 70% of your bills in the first 30 days when you expect 100% of your expenses to be paid. These algorithms are built into company planning software systems to assist you in making these estimates.
Step 4: Net Profit of the Project
This is your profit and loss statement, which details your company’s forecasts for the next three years. Use the figures from your sales forecast, expense projections, and cash flow statement. Net profit is calculated by deducting expenses, interest, and taxes from the gross margin.
Step 5: Deal with Your Liabilities and Assets
You must deal with assets and liabilities that aren’t listed on the income statement and forecast your company’s net worth at the end of the fiscal year. Compile and indicate your cash flow month by month, considering accounts receivable (money owing to you), inventory (if applicable), land, buildings, and equipment. Then, determine your liabilities or obligations, including accounts payable (money owed by your company) and debts owed on existing loans.
Step 6: Determine the Breakeven Point
When your business expenses equal your sales volume, you’ve reached the breakeven threshold. This analysis should be possible based on your three-year income prediction. Your overall revenue should eventually exceed your general expenses if your business is viable. This is crucial information for potential investors who want to make sure they’re investing in a firm that’s developing swiftly and has a plan to exit. You can also see more on Business Report.
FAQs
What is financial reporting’s primary goal?
Financial reporting’s purpose is to monitor, analyze, and report on your business’s revenue. The purpose of these reports is to examine the business’s resource utilization, cash flow, performance, and financial health. This enables you and your investors to make informed management decisions about the company.
When it comes to financial statements and financial reporting, what’s the difference?
Financial reporting is the means of providing information to business stakeholders to aid in decision-making, and the financial statement is the result of that process. It is critical to distinguish financial reporting from financial statements. The primary goal of financial reporting is to provide helpful information for decision-making. Businesses are composed of various stakeholders who have varying degrees of influence and interest in the organization. They require periodic data reports to make numerous decisions. Financial Statements are prepared for a specific accounting period, which is typically one year. This period of accounting is referred to as a fiscal year.’ It is not the same as a calendar year. The accounting period may vary according to the business or industry’s requirements. For instance, many companies in the retail sector end their fiscal year in January due to the high sales volumes experienced throughout the calendar year.
What is the difference between GAAP and International Financial Reporting Standards (IFRS)?
The standard structure, concepts, and methods used by firms for financial accounting are generally accepted accounting principles or GAAP. The Financial Accounting Standard Board publishes the guides (FASB). It is a set of accounting standards that include standard methods and rules for documenting and reporting financial data, such as the balance sheet, income statement, and cash flow statement. In the United States, publicly traded corporations and many private companies have adopted the framework. It ensures the financial statement’s transparency and consistency. The information offered by the financial statement by GAAP is helpful to economic decision-makers such as investors, creditors, shareholders, and others. While IFRS stands for International Financial Reporting Standard, it is a globally accepted financial reporting standard developed by the International Accounting Standard Board (IASB). It was previously known as the International Accounting Standard (IAS). The standard is used to prepare and present financial statements such as the balance sheet, income statement, cash flow statement, equity changes, and footnotes. The International Financial Reporting Standards (IFRS) ensure that international business is comparable and understandable. Its goal is to offer users information on its financial position, performance, profitability, and liquidity to make informed economic decisions.
What is the difference between an income statement and a balance sheet?
A balance sheet shows assets, liabilities, and equity at a specific point in time, while an income statement shows revenues and expenses over a specific period. You can also see more on Corporate Report.
What is the role of GAAP and IFRS in financial reporting?
GAAP (Generally Accepted Accounting Principles) and IFRS (International Financial Reporting Standards) are frameworks that ensure consistency and accuracy in financial reporting. Companies follow these rules to create reports that meet global standards. Adhering to these standards builds trust among investors and ensures regulatory compliance.
What is the significance of cash flow in a financial report?
The cash flow statement provides a detailed analysis of cash inflows and outflows related to operations, investments, and financing. It highlights the company’s ability to generate cash, manage debts, and fund future activities. Investors prioritize cash flow information to determine a company’s liquidity. You can also see more on Budget Report.
