20+ SAMPLE Operations Report
-
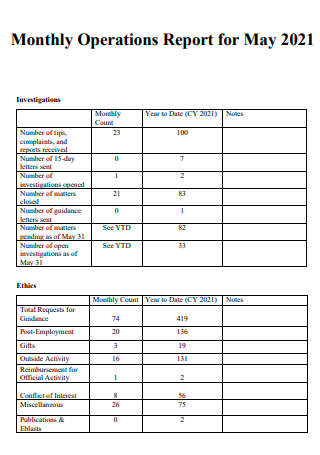
Monthly Operations Report
download now -
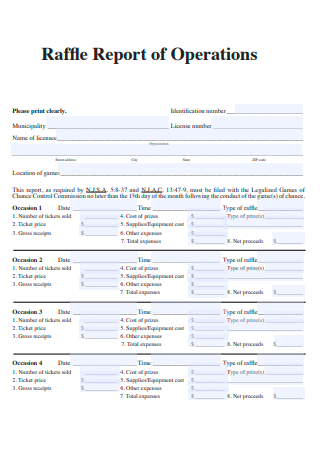
Operations Report of Raffle
download now -
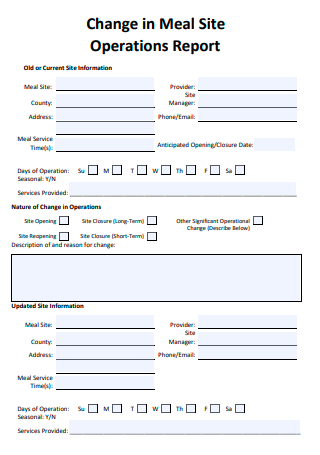
Change in Meal Site Operations Report
download now -
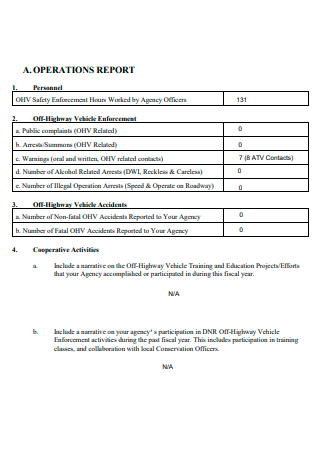
Basic Operations Report
download now -
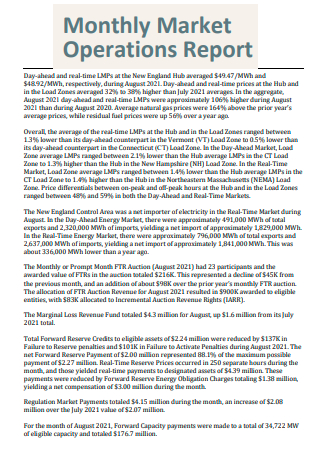
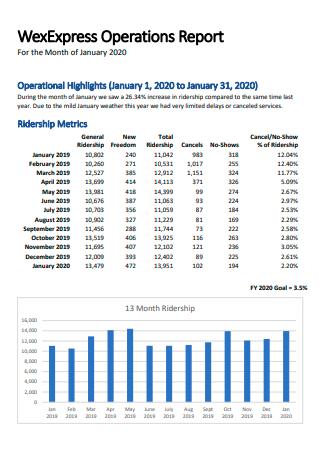
Monthly Market Operations Report
download now -
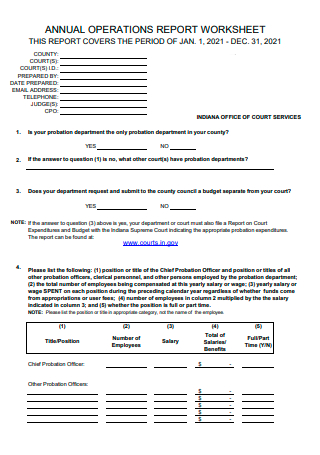
Annual Operations Report Worksheet
download now -
Operations Report Example
download now -
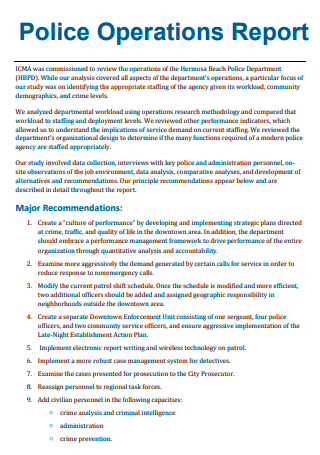
Police Operations Report
download now -
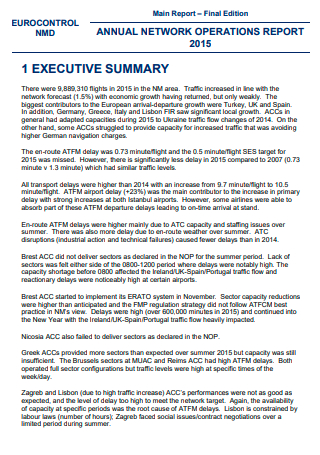
Annual Network Operations Report
download now -
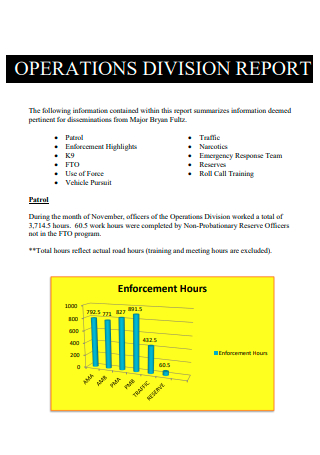
Operations Division Report
download now -
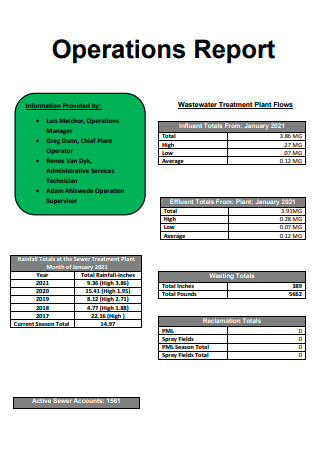
Operations Report in PDF
download now -
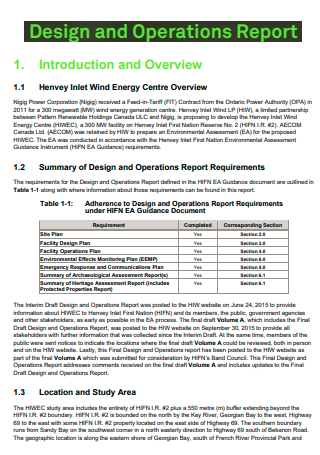
Design and Operations Report
download now -
Standard Operations Report
download now -
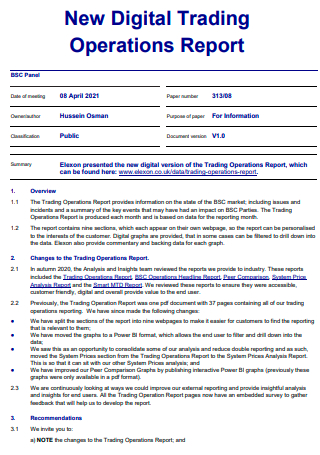
New Digital Trading Operations Report
download now -
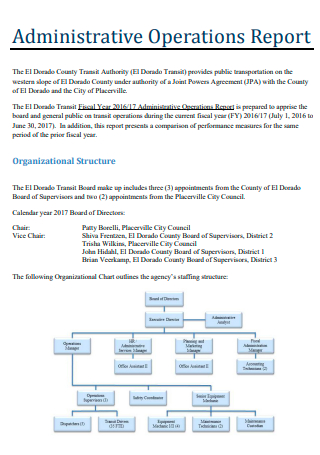
Administrative Operations Report
download now -
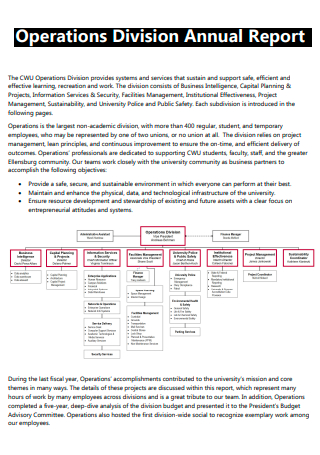
Operations Division Annual Report
download now -
Suspicious Operations Report
download now -
Flight Operations Report
download now -
Formal Operations Report
download now -
Annual Department Operations Report
download now -
End Of Operations Report
download now
FREE Operations Report s to Download
20+ SAMPLE Operations Report
What Is an Operations Report?
What’s Inside an Operations Report?
How to Create an Operations Report
FAQs
What is real time operational reporting?
Can digital tools be used when preparing an operational report?
What is pixel perfect operational reporting?
What Is an Operations Report?
First of all, let’s talk about what operational reporting is all about. Operational reporting is a method of recording, evaluating, and analyzing a company’s regular deliveries and metrics on a daily, weekly, or monthly basis, with the goal of improving performance. The process of operational reporting allows the company to gain important insights into how it operates, allowing them to make rapid real-time decisions, improve operational efficiency, save time and money, spot emerging trends, and ensure the company’s long-term growth by encouraging internal cohesion among the members.
In relation to that topic, the process of operational reporting involves a document called an operations report. An operations report is a business document, more specifically a report, that represents an organization’s current activity levels and the influence those actions have on the firm as a whole. Any duties linked to making a profit and expanding the firm’s total worth are covered in the usual operations report of a corporation. This sort of document can be used to summarize the present state of a certain operation or project, to guarantee that specific functions are executed in order to improve income and profit, and for specific projects or reporting units as determined by the company.
What’s Inside an Operations Report?
Here are the most common components of an operations report; It should be noted that there may be more elements present that totally depend on how the said report is being used and the type of company that prepares the document.
How to Create an Operations Report
Now that the necessary details of an operations report and its key components have been discussed, it’s time to have a look at the steps needed to create an effective operations report:
1. Identify the Objectives
When creating the operations report, the first step that needs to be done is to identify the objectives of the said report. It’s no use creating the said document when the goals of creating it are not even known, essentially creating one in the blind. Some of the objectives that can come with creating an operations report are identifying the key personnel who has contributed the most to the company within a certain timeline, assessing the company’s sales performance, determining the costs of undertaking particular projects, and looking for different methods to improve company productivity and performance based on data that is to be presented in the report.
2. Identify the Period to be Covered
After determining the purpose of creating the operations report, proceed to this step, which is to determine the timeline that is going to be covered in the document. This step may be simple but is necessary since operations reports can cover different time periods, which range from daily, weekly, monthly, or annually. Determining the time period to be covered in preparing the operations report is essential since it allows the people preparing the document to focus on the events that transpired within that time period and not go all over the place from different timelines and make the document a hot mess which can deviate the document from its intended purpose.
3. Gather and Categorize Information
After determining the time period that needs to be covered in the operations report, it’s time to begin the data gathering process. When obtaining data for the report, keep in mind that the kind of organization and the time period chosen will influence the results. The majority of reports are utilized to depict current activity levels in a firm as well as any influence that activity has had over a certain time period. After you’ve gathered all of the information you’ll need, divide the data in your report into distinct categories for easier reading and data analysis.
4. Report on Everything
After gathering and categorizing all the data that is needed in the report, it’s time to proceed to this step, which is to make a comprehensive report on everything that was gathered. It should be comprehensive to the point that everything should be reported, including every success and failure that the company has endured within the chosen time period. It should be noted also that by being comprehensive in the report, an opportunity presents itself to the company to have a better idea of what the situation currently is and allows the company to have a better chance of reaching the stated goals in creating the report.
5. Conclude the Report
After making a comprehensive report on every data gathered during a chosen time period, proceed to this step, which will also serve as the last. Naturally, the last important step in creating the operations report would be to make its conclusion. It should be noted that the conclusion should relate to the overall established goal for making the report and must show the company’s overall state as well as any suggestions that can support the success of the company.
FAQs
What is real time operational reporting?
Real-time operational reporting is made up of analytics that provide, as you guessed it, real-time operational data. Managers or operatives throughout departments can react to trends as they emerge by using a combination of visualizations that reveal insights as they arise. This allows for informed decision-making on issues such as issue management, departmental performance, and short-term operational planning. Finally, real-time operational reporting allows firms the chance to become more flexible, adaptive, and communicative, which leads to increased organizational production and profitability.
Can digital tools be used when preparing an operational report?
Yes, it can be used. In fact, it is more preferred. This is because operational reporting on paper can prove to be a time-consuming and sometimes ineffective process. Aside from the risk of data loss, producing the report and communicating it to important people that needs it will usually take double amounts of effort. Using digital technologies can help businesses avoid the challenges that a paper-based approach has caused. Furthermore, the simplicity of reporting and communication provided by various digital tools that exist would greatly assist firms in having a clearer perspective of performance and achieving goals more effectively.
What is pixel perfect operational reporting?
Pixel perfect operational reporting is a type of operational reporting which is best for instances when extreme accuracy is required. Invoices, papers, and other forms that need precise formatting are utilized to create pixel flawless reports. A tax form that has to be exported, printed, and preserved for regulatory compliance is an example of this.
Operations reports are usually used to report on up-to-date activities that a company usually undertakes in a given period of time as well as the impacts that the activity has on the said company. By having one, a company has the opportunity to be on track for more success and stable growth by fostering internal cohesion within the employees and improving its operational infrastructure. Creating this document may be intimidating and difficult, but with the help of the sample templates that are present in this article, you should have an idea as to what this document looks like which can greatly aid you in the process of creating one.