Sample Distribution, PDF
-
Commodity Distribution
download now -
Distribution Plan
download now -
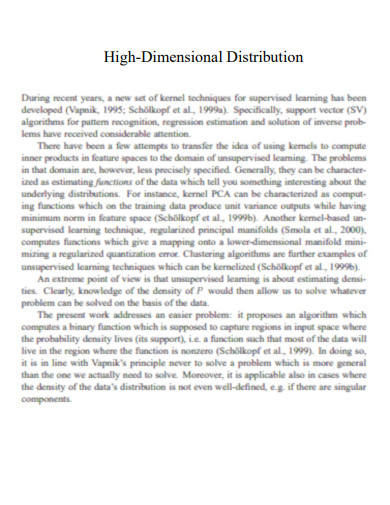
Meta Distributions
download now -
General Distribution
download now -
Spatial Distribution and Density of Population
download now -
Designing the Distribution Network
download now -

Distribution Franchisee
download now -

Technical Audit for Power Distribution System
download now -
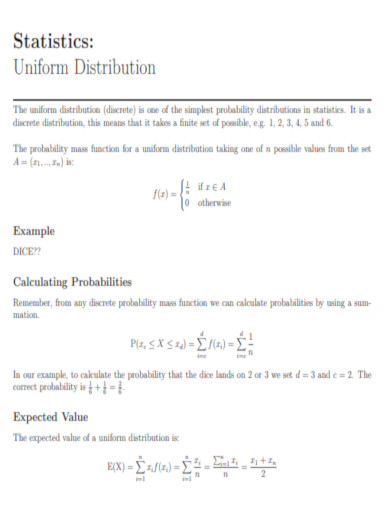
Statistics Uniform Distribution
download now -
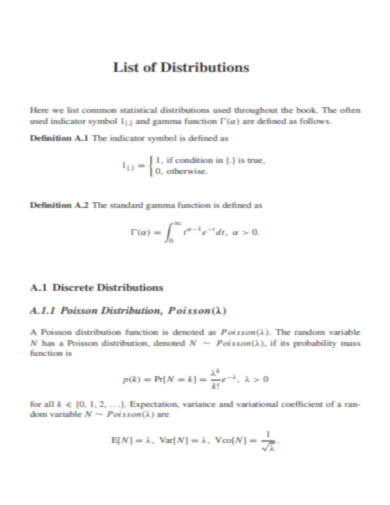
List of Distributions
download now -

Mask Distribution
download now -
Time Distributions of Heavy Rainstorms
download now -

Distribution Board
download now -
New Method of Generating Distribution
download now -

Distribution of Income
download now -
Moderate Distribution
download now -

Revamped Distribution
download now -

Dividend Distribution Policy
download now -

Coal Production Marketing & Distribution
download now -
Repeated Dose Tissue Distribution Studies
download now -
Theory of Distribution
download now -
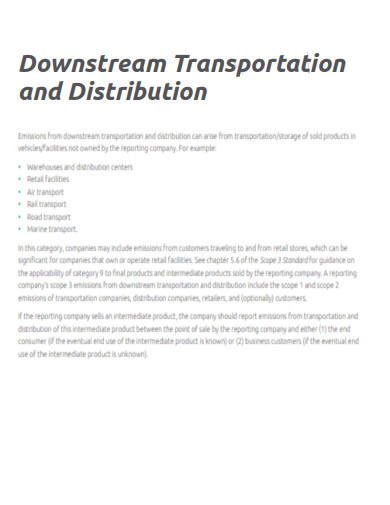
Downstream Transportation Distribution
download now -
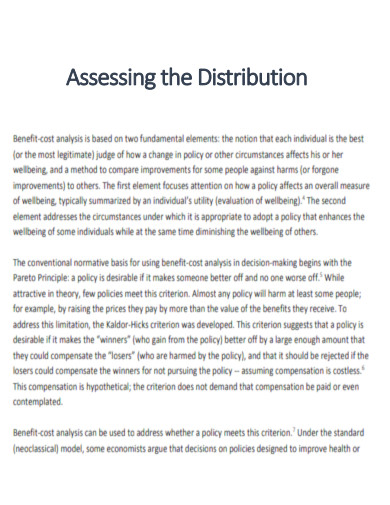
Assessing the Distribution
download now -
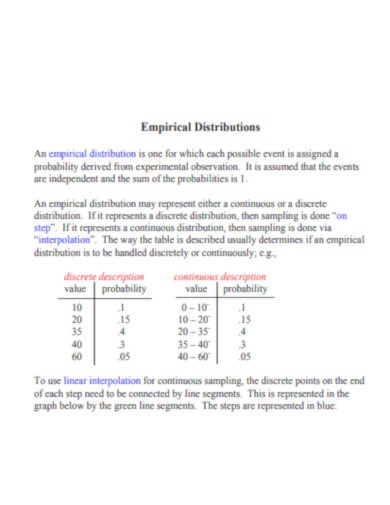
Empirical Distributions
download now -
Editable Distribution
download now -

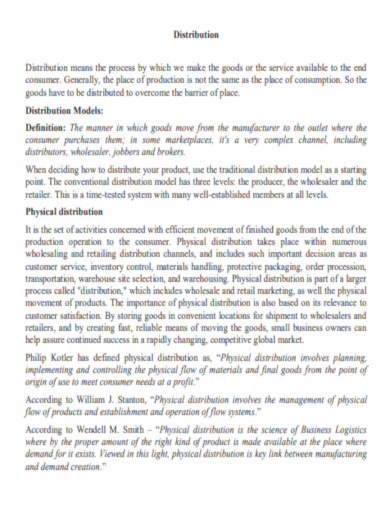
Channels of Distribution
download now -
Pharmacokinetic Processes Distribution
download now -
Distribution Reports
download now -
Distribution Fields
download now -
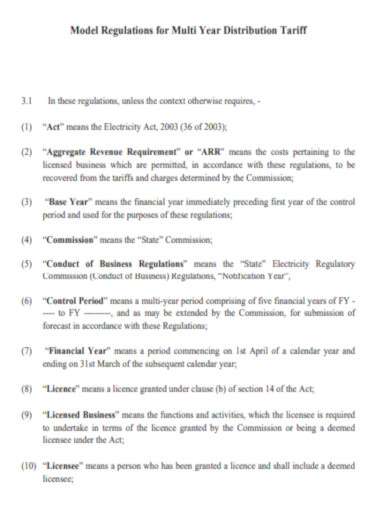
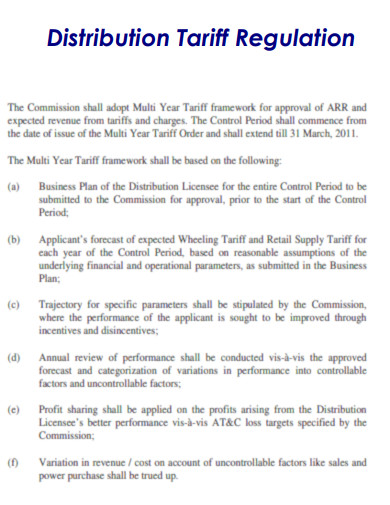
Multi-Year Distribution Tariff
download now -

Sectional Distribution Of Work
download now -

Asset Distribution
download now -
Basic Distribution
download now -

Distribution of Firm
download now -
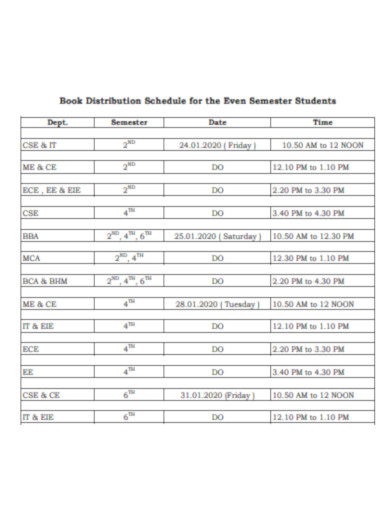
Book Distribution Schedule
download now -
Distribution Example
download now -
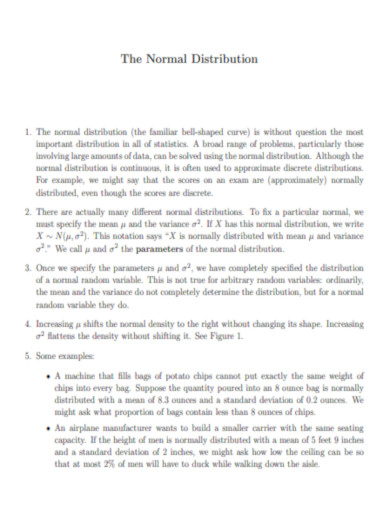
Normal Distribution
download now -
Distribution of Biological Products
download now -
Primary Distribution of Income Account
download now -
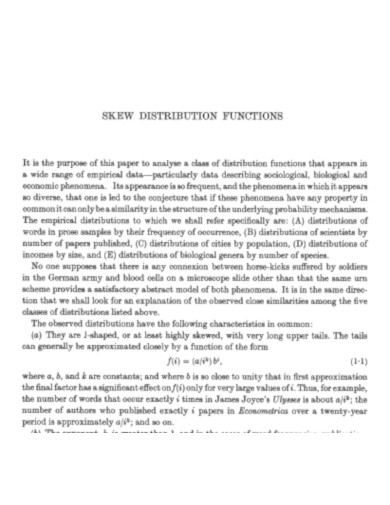
Skew Distribution Function
download now -
Printable Distribution
download now -

Distribution System Automation
download now -
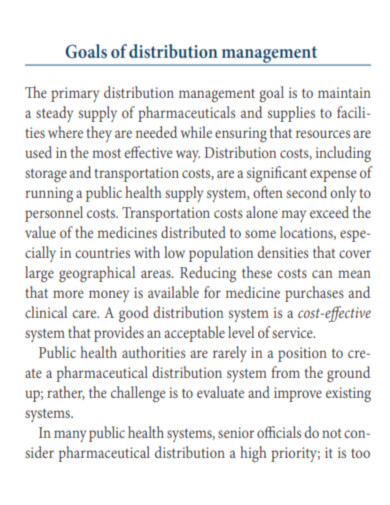
Goals of Distribution Management
download now -
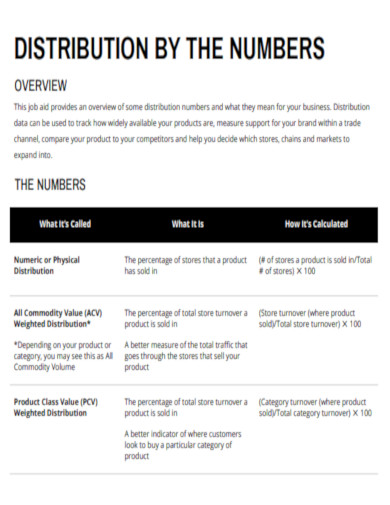
Distribution by Numbers
download now -
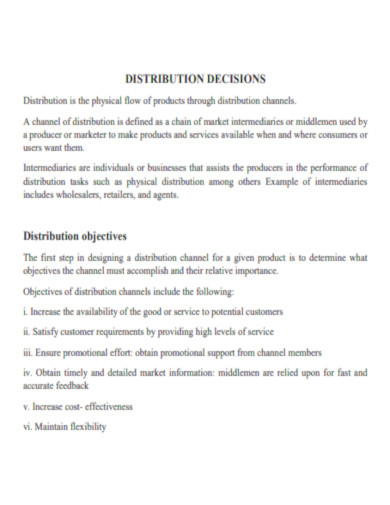
Distribution Decision
download now -
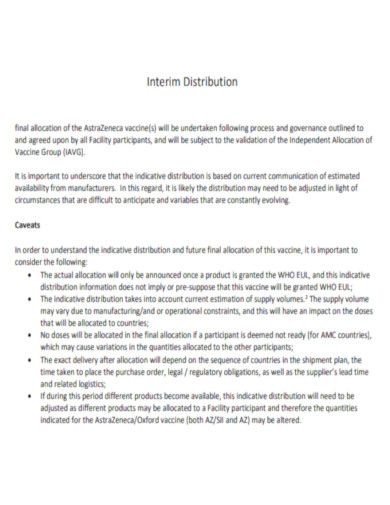
Interim Distribution
download now -
Distribution Management Plan Guide
download now -
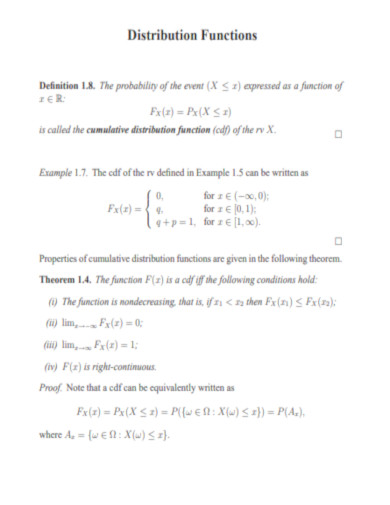
Distribution Functions
download now -
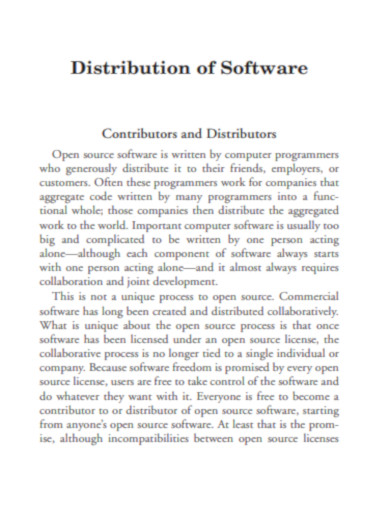
Distribution of Software
download now -
Distribution Traffic Regulation
download now -

Sales and Distribution Management
download now -
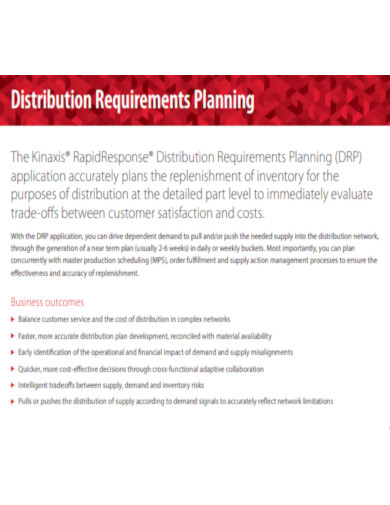
Distribution Requirements Planning
download now -

Public Distribution System
download now
What Is Sample Distribution?
A sample distribution is a statistic that determines the likelihood of an event based on data collected from a small subset of a large population. Its primary objective is to assess the representativeness of tiny samples from a relatively larger population. Since the population is too huge to evaluate, you can select a smaller subset and sample or analyze them repeatedly. The collected data or statistic calculates the likelihood or probability that an event will occur. A sample distribution streamlines drawing conclusions or inferences from massive amounts of data.
Benefits of Sampling
Sampling is selecting a sample from a person or a bunch of people of a certain kind for research purposes. In sampling, the population is split into some parts called sampling units. Sampling makes things easier, collects detailed and complete data, uses limited resources best, and improves relationships. On top of that, sampling also has the following benefits.
Tips to Complete Data Collection
The systematic gathering of information through observations or measurements for research is known as data collection. Professionals, businesses, governments, and other organizations utilize it to inform their judgments in a process known as data-based decision-making. Below are six methods for collecting data:
1. Identify Possible Data Collection Opportunities
The first step in data collection is to identify a situation in which this procedure would benefit you or your company. This can include circumstances in which sales data is required, public opinion regarding a product, brand, or firm is desired, or information must be preserved for future use. Opportunities for data gathering arise from issues in the workplace, such as inefficient processes or declining sales, which can be addressed and solved through data collection and data-driven decision-making. There may also be multiple options from which to select.
2. Select Options and Establish Objectives
Once you know your options for gathering data, you can decide which ones you want to pursue. Some may be easier than others, but most lead to good things, like more sales or more information sheet templates. Also, set goals for how you want the data to be used and why that data is essential to you or your organization after you choose the opportunities you want to pursue. This can help you better gather data and make short-term and long-term projects that you can give to project teams.
3. Plan Techniques for Data Collecting
After preparing your opportunities and objectives, you can establish plans for short- and long-term projects. This includes assigning teams to work on the projects, developing methods for storing information, and determining how much data you wish to collect. This is also where you may select the data-collecting techniques you will employ, depending on the sort of data you want to order. Using questionnaires, for instance, is an excellent approach to collecting information on public opinion. Monitoring social media reports, Instagram and online marketing proposals might generate data that can be used for other projects.
4. Validate Your Measuring Systems
Once you have created your data collection sheets and chosen a method, you must confirm that your measurement systems are accurate and that you are collecting the desired data. Proper measures are crucial for data gathering because the data you collect can help you make decisions. Having precise data measurements, particularly for quantitative data, can assist you in making the best decisions for your business. This stage is especially significant since it can help you determine the best data collection methods for your specific needs and build rigorous data collection strategies.
5. Collect Data
After developing plans and techniques for obtaining the desired data, you can implement those plans. This can be the most time-consuming step in the data-gathering process because you may need to collect hundreds of data points, depending on the data type and collection method. Setting a start and end date for data gathering enables you to handle the information more correctly. Others, like interviews and research, can be implemented and conducted quickly but require more time for interpretation.
6. Analyze the Data
After completing data collection or setting a time to halt data collection for continuing techniques, you can examine your results. This includes structuring it so that you and your project teams can comprehend it and then analyzing it to guide your decisions. A combination of qualitative and quantitative data is frequently helpful in making decisions. When you understand your data, asking for thoughts about your brand after detecting a decline in sales, for instance, can help you create actions that enhance public opinion and sales.
How to Create a Data-Driven Decision Making:
Collecting data established on your company’s key performance indicators (KPIs) and integrating that data into actionable insights is data-driven decision-making. This procedure is an integral component of contemporary company strategy. Making decisions based on data requires practice. If you want to develop your leadership abilities, you must be able to transform raw data into concrete steps that support your organization’s ambitions. When examining data, the following stages can help you make better decisions.
1. Know Your Objective
Before making informed judgments, you must comprehend the future vision of your firm. This allows you to utilize both data and strategy while making decisions. With supporting context, graphs, and numbers have more value. Utilize your organization’s annual objectives and key results (OKRs) or quarterly team KPIs to make decisions based on facts.
2. Find Data Sources
Once you have determined your objective, you can begin gathering data. The techniques and data sources you employ will be determined by the type of data you are collecting. Use a universal reporting tool to assess data sets relevant to internal business processes. Reporting tools provide a centralized location for monitoring work progress across an organization. Some reporting solutions, such as Microsoft’s Power BI, permit collection of data from several external sources. You can use one of these tools to examine marketing trends or rival analytics. You can measure a range of additional data sets based on your job function and goals. Real-time data aggregation is made more straightforward than ever by machine learning.
3. Organize Your Data
Organizing your data to improve data visualization and make sound business judgments is essential. It is tough to ensure that you are making the most informed judgments if you cannot access all your relevant data in one place and understand how it connects. An executive dashboard is one method for data organization. The executive dashboard is a configurable interface typically included with your universal reporting tool. This dashboard will display the facts most important to attaining your objectives, whether they are strategic, tactical, analytic, or operational.
4. Perform Data Analysis
After organizing your data, you can commence your data-driven analysis. This is when you will extract insights from your data to aid decision-making. Depending on your objectives, you may evaluate the data from your executive dashboard in conjunction with user research, such as case studies, polls, or testimonials, to ensure that your conclusions incorporate the consumer experience. Your team’s SEO tools could be improved to make them more competitive with other solutions on the market. You may need to collect some of this information from other sources, as some will come from your organization. When you study these data sets collectively, you will reach a different conclusion than if you were to analyze each data set separately. Share your analytic tools with your entire organization or team. As with any collaborative endeavor, data analysis plans are most effective when examined from multiple vantage points. While you may observe a particular trend in the data, a teammate will likely perceive something entirely different.
5. Draw Conclusions
As you analyze your data, you will likely draw judgments based on your observations. However, your conclusions merit their part, as it is essential to elaborate on what you keep in the data before sharing your findings with others. After answering these questions, you have effectively completed data analysis and should be prepared to make data-driven business decisions. Creating SMART goals is the logical next step following data analysis. Now that you’ve investigated the facts, you may set attainable goals based on what you’ve discovered.
FAQs
How do you find the sample distribution?
To determine the sample distribution, you must know the population’s standard deviation. Sum all the observations and then divide by the total number of observations.
What are the causes of sampling error?
Several factors influence sampling error, including sample size, sample design, sampling percentage, and demographic variability. More significant sample numbers generally reduce the sampling error, although this reduction needs to be proportionate.
How can sampling errors be prevented?
It is possible to avoid the majority of sampling errors by expanding the population size and ensuring that the majority of selected respondents sufficiently represent the remainder of the population. The better the outcome, the more carefully you sample and discover the ideal applicants for your survey report.
Researchers utilize sampling distributions to draw estimates and conclusions about a broader population of interest based on the data they access. These visualizations of sampling distribution data enable researchers to make precise inferences and gain a deeper understanding of a population as a whole. Are you prepared to apply sample distributions to comprehend a population in your research better? If so, follow the procedures above and your ideas immediately!