23+ SAMPLE Sales Summary Report
-
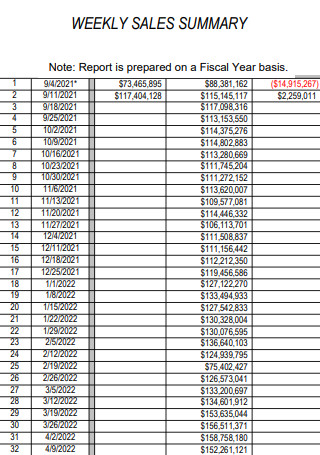
Weekly Sales Summary Report
download now -
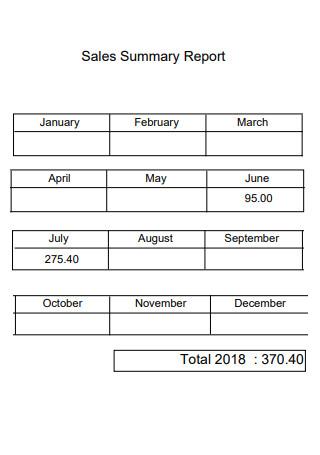
Sales Summary Report
download now -
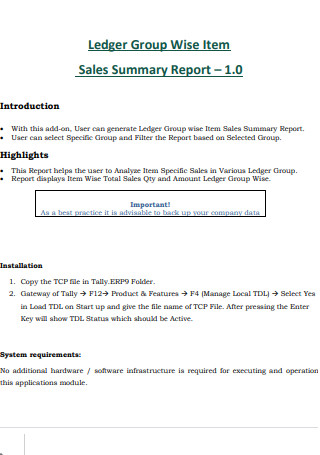
Group Wise Item Sales Summary Report
download now -
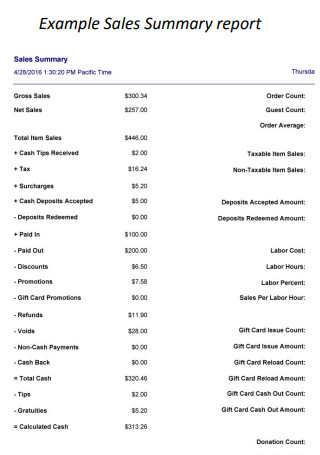
Sales Summary Report Example
download now -
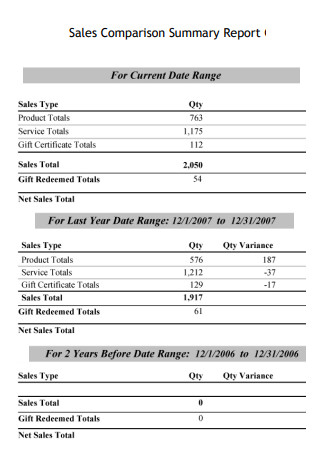
Sales Comparison Summary Report
download now -
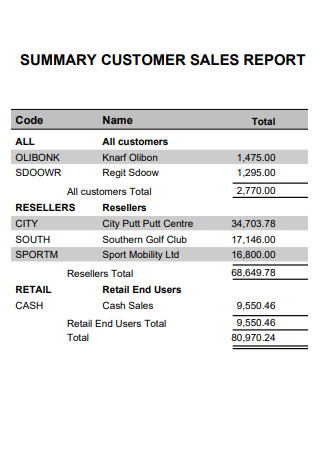
Customer Sales Summary Report
download now -
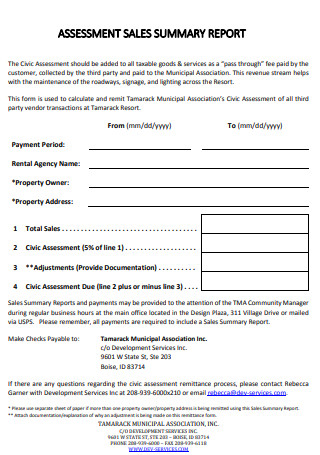
Assessment Sales Summary Report
download now -
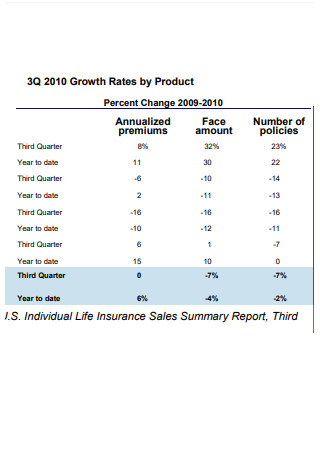
Insurance Sales Summary Report
download now -
Sample Sales Summary Report
download now -
Wholesaler Sales Summary Report
download now -
Executive Sales Summary Report
download now -
Residential Sales Summary Report
download now -
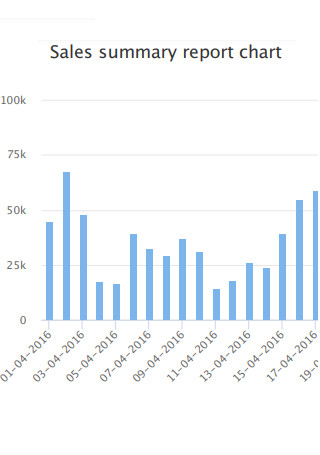
Sales Summary Report Chart
download now -
Nearby Sales Summary Report
download now -
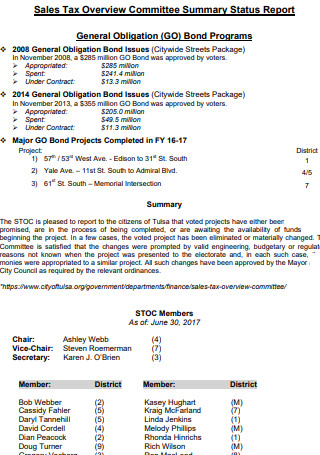
Sales Tax Overview Committee Summary Status Report
download now -
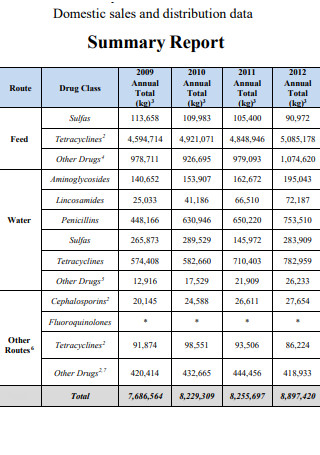
Domestic Sales Summary Report
download now -
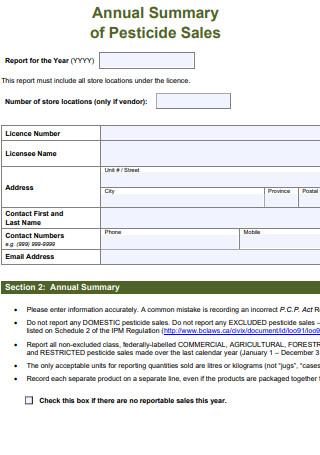
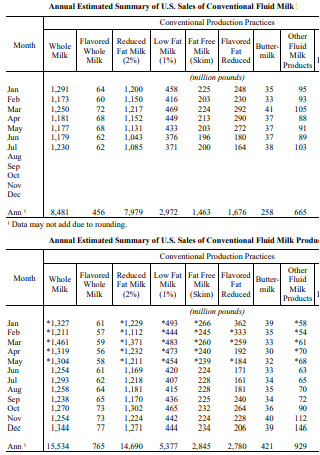
Annual Summary of Pesticide Sales
download now -
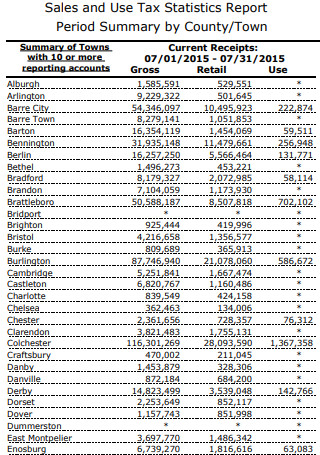
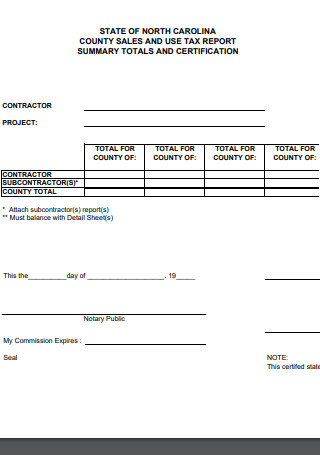
Sales and Use Tax Statistics Report Period Summary
download now -
Formal Sales Summary Report
download now -
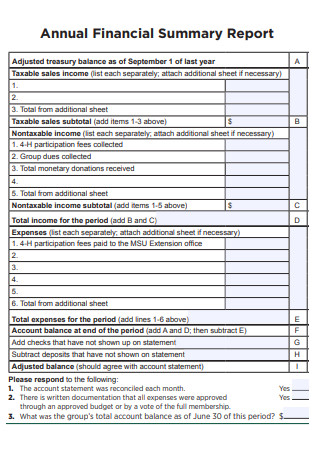
Annual Sales Financial Summary Report
download now -
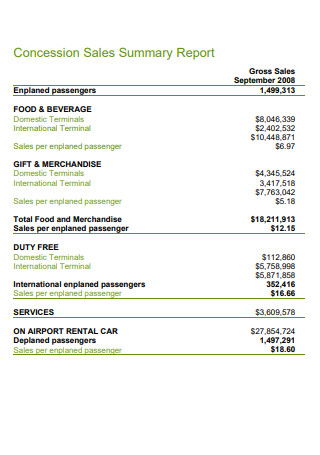
Concession Sales Summary Report
download now -
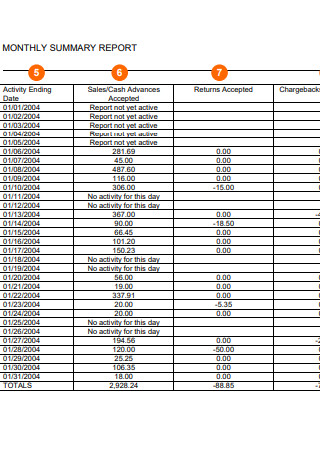
Monthly Sales Summary Report
download now -
Sales And Tax Summary Report
download now -
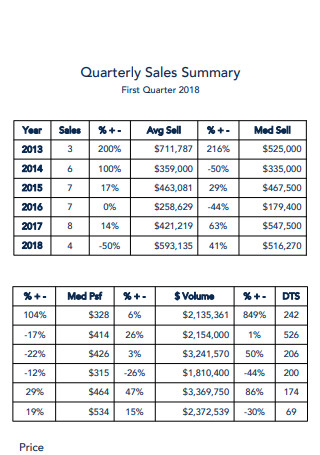
Quarterly Sales Summary Report
download now
FREE Sales Summary Report s to Download
23+ SAMPLE Sales Summary Report
What Is a Sales Summary Report?
Types of Sales Reports
Components of a Sales Summary Report
How To Create a Sales Summary Report
FAQs
What is a daily sales summary report?
What are the most important sales reports?
What are KPIs in sales?
What Is a Sales Summary Report?
A sales summary report is a business document that contains information about associated sales of a store or business within a selected date range. The entirety of the sales summary report consists of subcategories or subreports within the particular dates. Sales summary reports are one of the most commonly used reports in business and store operations because it details daily activities and showcase the financial capacities of the organization. It breaks down various factors that affect the sales of a particular store in an organized manner. The reports also help the business to visualize future trends surrounding the industry, including consumer preferences, to increase sales capacity and growth. Sales summary reports contain various visual elements that help find potential market opportunities. Sales teams utilize the information available to assess situations, determining possible countermeasures or actions to undertake to prevent loss.
According to data presented on Statista by the Statista Research Team published in October of 2021, by the end of 2020, total retail sales in the United States reached an estimate of 5.6 trillion US dollars, and the figures show an increase from the year before by approximately 180 billion US dollars. The graph indicates that retail sales indicate a steady growth over the years, showing the importance of tracking sales trends and patterns to increase sales growth.
Types of Sales Reports
There are multiple types of sales reports that supply information about different facts and data into the result of sales processes for a period. Each report emphasizes various attributes relating to business sales. Below are different types of sales reports within an organization, and it is essential to know about them.
Components of a Sales Summary Report
Despite different industries and organizations having various schematics in creating sales summary reports, there are standard components that must be present to have a successful and comprehensive sales summary report. Below are the sales summary report elements with accompanying descriptions the company must include in its next document. Continue reading the following section.
How To Create a Sales Summary Report
After determining the essential elements in a sales summary report, the next step is to understand the step-by-step method in creating the document. Anyone can indicate numbers into a sales summary and add various types of information. The goal is to make people understand what these numbers and descriptions mean. Follow the guidelines below and guarantee that your report is easy to read and understand, supplying the reader with ample and factual information.
-
Step 1: Identify the Purpose of the Report
It is near impossible to include all the information in a sales summary report. The idea is to focus on incorporating relevant data that helps the company in achieving its Business Goals. It is critical to know the purpose of creating the report. Knowing the main objective of the sales summary assists in data gathering and data analysis of the relevant information for the report. It also helps identify the scope of the summary, resulting in a successful sales presentation.
-
Step 2: Familiarize Yourself with the Audience
The next step of creating a sales summary report is to identify the audience of your description to help you tailor the information effectively and understandably. The goal of identifying your readers is to hold their attention and interest throughout the length of the report. Guarantee that the data present in the report shows relevance to what the audience wants to know, supplying them with the knowledge to make necessary decisions.
-
Step 3: Collect the Relevant Data
After knowing the purpose and the audience of the report, it is time to gather and analyze the appropriate data. During the data collection process, ensure that you remain goal-oriented. Begin with outlining the metrics and key performance indicators you need to include in the report. The content ranges from made sales, net sales, profits, tax deductions, sales growth, new opportunities, and Team Performances. It is also essential to indicate the time frame of the information, including past and present comparisons, to stress necessary changes.
-
Step 4: Utilize Visualization Elements in the Report
The way data is present in the report is equally important to the contents. Ensure that your data is understandable by using visualization elements in your presentation. Aside from tabular data full of numbers, utilize graphs and charts for the report, including Gantt Charts or line graphs. Visualizing your data makes the report easier to understand and digest. It also allows you to emphasize the relevant trends and address the issues affecting sales. Additionally, utilizing visual elements makes for an attractive presentation that captures the attention of audiences.
-
Step 5: Put the Numbers in Context
Ensure that all numbers present in the report have context, or else it will be misleading and cause misinterpretations. For example, a negative shift in sales over a month without context can cause alarm to managers. However, adding an explanation to the occurrence, for example, bad weather conditions, to prevent any hasty decisions. It is best to know the context behind the information present in the report.
FAQs
What is a daily sales summary report?
A daily sales summary report supplies information about daily financial transactions. It contains information like daily closed deals, clients conversations, created opportunities, and other relevant information. The report focuses on process metrics rather than outcome metrics.
What are the most important sales reports?
- Sales funnel analysis report – contains the numbers or leads and conversion rates during each stage of the pipeline. It strengthens lead generation and increases deals.
- Incoming deals volume report – the purpose of using the report is for sales teams to reach their respective goals. It reveals the actual number of made deals coming from marketing.
- Forecasting sales report – the report shows the number of predicted sales, comparing it to actual sales.
- Sales goals report – the sales goals report represents the set revenue goals of sales teams from previous reports.
- Won deals report – the report details closed deals by sales representatives and sales teams.
What are KPIs in sales?
Sales key performance indicators (KPIs) are metrics that support sales teams in measuring the effectiveness and accuracy of reaching goals, including improving methodologies to increase sales.
Companies that focus on marketing and sales write up sales summary reports more often than not. Having these documents ensure that they are on right track with their goals, especially with closing sales and increasing revenue. For many organizations, utilizing summary reports using online dashboards is convenient, as it is easy to track and access. Sales teams must set goals for their department as they have a target to follow and achieve. In the words of Laurence J. Peter, “If you don’t know where you are going, you will probably end up somewhere else.”. Start creating a sales summary report by downloading the samples available above in PDF format to achieve company goals.