18+ Sample Quantitative Data Analysis
-
Quantitative Data Analysis Template
download now -
Workshop Quantitative Data Analysis
download now -
Basic Quantitative Data Analysis
download now -
Quantitative Data Analysis in PDF
download now -
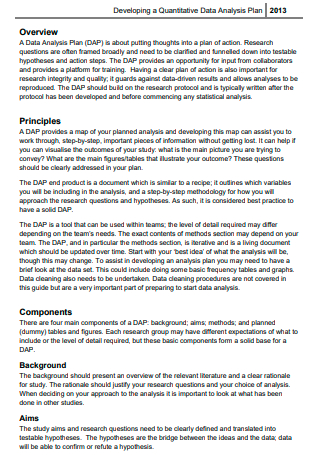
Quantitative Data Analysis Plan
download now -
Formal Quantitative Data Analysis
download now -

Quantitative Data Analysis Example
download now -
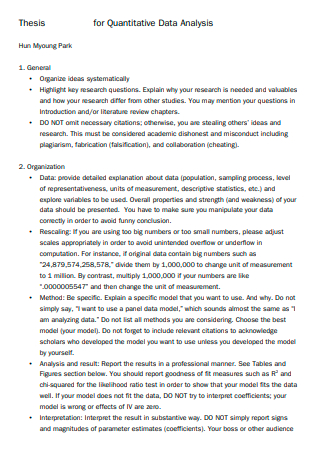
Thesis For Quantitative Data Analysis
download now -
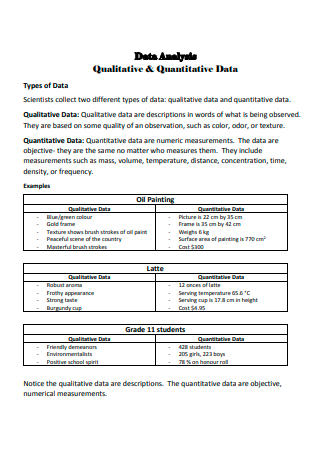
Qualitative and Quantitative Data Analysis
download now -
Standard Quantitative Data Analysis
download now -

Construction Research Quantitative Data Analysis
download now -
Printable Quantitative Data Analysis
download now -
Quantitative Data Management Analysis
download now -
Social Research Quantitative Data Analysis
download now -
Sample Quantitative Data Analysis
download now -
Quantitative Data Analysis and Representation
download now -
Quantitative Data Analysis Format
download now -
Simple Quantitative Data Analysis
download now -
Draft Quantitative Data Analysis
download now
FREE Quantitative Data Analysis s to Download
18+ Sample Quantitative Data Analysis
What is quantitative data analysis?
Sampling Methods for Quantitative Research
How to Analyze Quantitative Data
What are the types of quantitative research?
What are examples of quantitative data?
What are disadvantages of non-probability sampling?
What is quantitative data analysis?
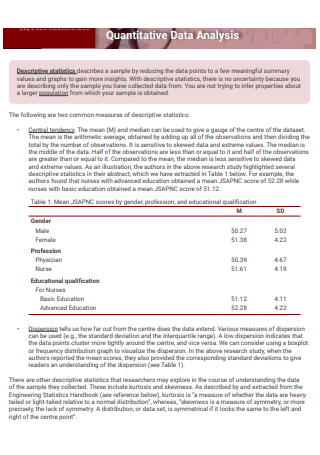
Quantitative data pertains to data presented in the form of numbers wherein each set of data is in correspondence with a numerical value. Any quantifiable data is used to perform mathematical calculations and statistical analysis, hence these are to be ultimately recorded and reflected in the study as well. The analysis of these sets of quantitative data through statistical techniques is called quantitative data analysis. To understand the process of the analysis better, researchers should take note of the two main branches of statistics, which is the main method of interpreting numerical data , which are descriptive statistics and inferential. Descriptive statistical methods describe the technicalities of certain data through standard deviation, mean, median, and skewness. Through this method, we are able to identify the common properties of each set of data. On the other hand, inferential statistical methods describe a general population through deducting the focus towards only a sample of the whole itself in order to make a generalization.
Sampling Methods for Quantitative Research
Sampling is an integral part especially in making quantitative research. It purpose is simply to generate an inference through examining a part of the whole. The sampling method you choose is very arbitrary of the kind of results you are going to get in your research, as it determines the accuracy and the individual selection of where the study mostly circumnavigates its focus on. Generally speaking, in statistical studies, samples are used when the whole population is too large to gauge. Samples serve as the representation of the population, hence they should be chosen without bias, and are at best highly objective. Quantitative data analysis simply cannot stand without the proper sampling method that tailor-fits the kind of research being conducted to begin with. Here are examples of sampling methods essential in quantitative research.
How to Analyze Quantitative Data
After learning the different ways of gathering samples in order to draw quantitative data, researchers now have to analyze and interpret the sets of numerical value they have at hand. In the aftermath of the analysis, researchers should be able to answer the “what” and “how many” questions they have regarding the topic, and that is what sets it apart from qualitative research. It is important to follow the important steps in analyzing quantitative data since these amounts hold great gravity in your research. Here are the steps in analyzing your gathered quantitative data.
Step 1: Data Preparation and Organization
After using one of the methods of sampling in the earlier portions of this article, your data should be drawn and prepared for use in your study. The data and the results should be jotted down or taken note of in a document, and data sets should be indicated through legends for better interpretation and clarity.
Step 2: Data Interpretation
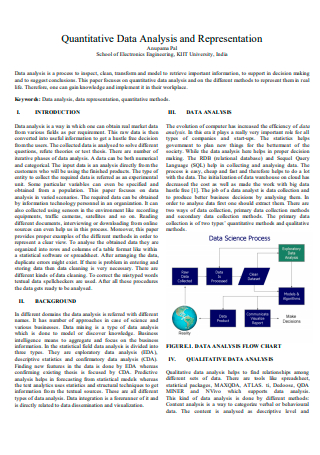
Quantitative data can be interpreted in two ways: descriptive statistics and inferential statistics. The former is used to describe sets of data, and summarize them in an orderly way, while the latter takes a portion of the whole in order to make generalizations about it, usually presented through probability distribution, hypothesis testing, regression analysis, and correlation testing. These data are then to be reviewed and explored by the researchers.
Step 3: Thematic Coding of Data
In order to better identify the data you are dealing with, it is important to code them in a way that lets them become a lot more attached to the problem that your research is focused on. One way to do this is through thematically coding your sets of data, depending on where you have drawn them. This is an essential part of the process since it enables you to have your data presentation be a lot more coherent and understandable.
Step 4: Data Presentation
In order to make your data more tangible and easily quantifiable, models are to be had. After the analytical methods undergone, graphical methods are then drawn in order present data. This could be done through a bar chart, pie chart, numerical table, or any graphical presentation of your choice, depending on the kind of data you are presenting. Each of these models have a specific target of data that are best shown through them.
What are the types of quantitative research?
The primary types of quantitative research are descriptive, which discusses the various characteristics of the target sample of the study, quasi-experimental which aims to build the cause and effect relationship between the different variables at hand in the study, and experimental which focuses on solving the problem at hand with a dominantly scientific approach.
What are examples of quantitative data?
Anything of numerical value can be branded as quantitative data, and this looks like length, mass, time, and temperature. The given examples are included but certainly are not what quantitative data are limited to.
What are disadvantages of non-probability sampling?
It is ultimately advisable to opt to the probability method of sampling, but sometimes, it is inevitable to choose the non-probability method. A few disadvantages are than it has an unknown proportion compared to the rest of the population, hence data outcome may very much well be non-inclusive to the situations of those outside the chosen circle. Another is that the overall generalization is deemed less reliable due to the nature of the sample chosen by the researchers.
Quantitative data analysis is very important in making complex data understandable, and even simplified for the public to consume. It is a meticulous process to be taken, hence every detail has to be correct and precise, from the data gathering, to the sampling techniques to be used, and everything in between. With all that said, these are things that contribute greatly to the betterment of our society as a whole by virtue of it standing and even lifted higher with the wonders of knowledge pushed forward by research.