18+ Sample Critical Path Analysis
-
Critical Path Analysis Chart
download now -
Greeneay Critical Path Analysis
download now -
Critical Path Analysis Example
download now -
Critical-Path Based Performance Analysis
download now -
Critical Path in Network Analysis
download now -

Primark and Critical Path Analysis
download now -
Sample Critical Path Analysis
download now -
Critical Path Analysis for Network
download now -
Simple Critical Path Analysis
download now -
Critical Path Analysis Schedule
download now -
Critical Path Analysis Challenge
download now -
Traditional Critical Path Analysis
download now -
Critical Path Analysis Format
download now -

Critical Path Analysis Pert Chart
download now -
Project Critical Path Analysis
download now -
Formal Critical Path Analysis
download now -
Correlation Critical Path Analysis
download now -
Printable Critical Path Analysis
download now -
Program Critical Path Analysis
download now
FREE Critical Path Analysis s to Download
18+ Sample Critical Path Analysis
What Is a Critical Path Analysis?
Important Elements of a Critical Path Method Schedule
Advantages Of a Critical Path
Step by Step Process In a Critical Path Analysis
FAQs
What is Critical Path Software?
What is a Crash Duration in a project?
What is PERT and how does it differ from a Critical Path Analysis?
What is “float” in a project task?
Are there any advantages of using Critical Path Software for analysis?
What Is a Critical Path Analysis?
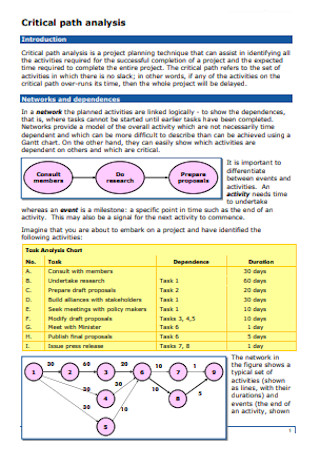
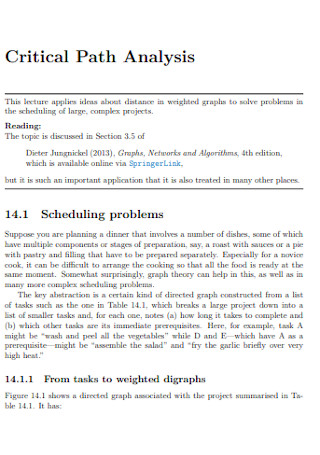
As defined, the critical path analysis, also known as the critical path method, is a scheduling procedure that employs a network diagram to depict a project and the sequences of tasks needed to complete it, which are referred to as paths. Once the paths are defined, an algorithm calculates the duration of each path to identify the critical path, which determines the total duration of the project. Similar to Gantt charts, a critical path analysis will help you to plan all tasks that need to be accomplished as part of the project.
A critical path analysis will also serve as the foundation for both the creation of a schedule and the allocation of resources. They allow you to track the progress of a project’s objectives while it is being managed. They assist you in determining where corrective action is required to get a project back on track.
Important Elements of a Critical Path Method Schedule
A CPM schedule contains many different elements. Here are the common ones, explained:
Advantages Of a Critical Path
Here are the advantages of using critical path analysis in a project; these daily advantages usually benefit the project managers:
- It identifies the most important tasks – First, it clearly identifies the tasks that the project manager will be responsible for closely monitoring. If any of the tasks on the critical path take longer than expected, start later than planned, or finish later than planned, then the overall project duration will be affected.
- It helps reduce timelines – Second, if there is interest in completing the project in a shorter time frame after the initial analysis predicts a completion time, it is clear which task or tasks are candidates for duration reduction. When the critical path method results are displayed as a bar chart, similar to a Gantt chart, it is easy to see where the tasks fall in the overall timeframe. You can see the critical path activities (which are usually highlighted), as well as the duration and sequences of tasks. This gives the project manager a new level of insight into the project’s timeline, giving him or her a better understanding of which task durations he or she can change and which must remain constant.
- It compares planned progress with actual progress – The critical path method is also useful for comparing planned and actual progress. The baseline schedule created from the initial critical path analysis can be used to track schedule progress as the project progresses. A manager can identify completed tasks, predict the remaining durations for in-progress tasks, and any planned changes to future task sequences and durations throughout a project. As a result, an updated schedule will be produced, which, when compared to the original baseline, will provide a visual means of comparing planned to actual progress
Step by Step Process In a Critical Path Analysis
Here are the steps to be used in the critical path analysis; they may be more, they may be less depending on the project that your company is undertaking.
-
1. Specify Each Activity
You must use a work breakdown structure in this step to identify each activity (or task) involved in the project. This list of activity specifications should only contain higher-level activities. When using detailed activities, the critical path analysis may become too difficult to manage and maintain. A work breakdown structure divides projects into manageable chunks. The first step is to identify the main project deliverables. Then you can begin to divide the high-level activities into smaller chunks of work.
You can also customize how your work breakdown structure is displayed. Some people prefer to use a tree structure, while others prefer to use lists or tables. One of the simplest ways to represent a work breakdown structure is with an outline.
-
2. Establish Dependencies
Dependencies can also be referred to as activity sequences. Some tasks will be dependent on the completion of others. Listing the activities’ immediate predecessors will assist you in determining the correct order. To correctly identify activities and their precedence, you must first identify the following factors: the other tasks that should occur before this task, the tasks that should be completed at the same time as this task, and the tasks that should occur immediately after this task
-
3. Create a Network Diagram
In this step, you can start to draw the critical path analysis chart (CPA), also known as the network diagram, once you’ve identified the activities and their dependencies. The network diagram is a visual representation of the dependencies that govern the order of your activities. This critical path diagram used to be drawn by hand, but now there are software programs that can do it for you.
-
4. Estimate the Activity Completion Time
You must now estimate the time required to complete each activity using previous experience or the knowledge of an experienced team member. If you’re in charge of a smaller project, you’ll probably estimate time in days. When working on a large project, you may need to measure time in weeks. If you don’t feel confident in your best-guess estimates, you can use the 3-point estimation method, which is designed to place more emphasis on the most realistic timeframe. Three-point estimation requires you to generate 3 different time estimates for each task based on prior experience or best guesses.
-
5. Identify the Critical Path
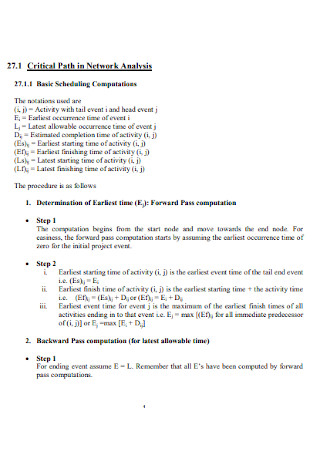
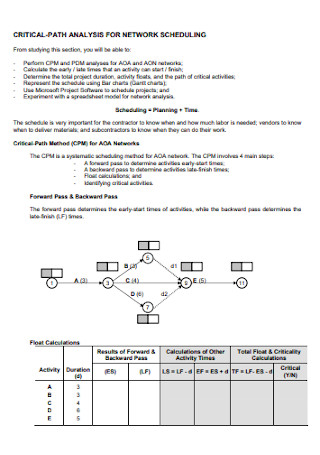
You can start identifying the critical path in this step. There are two methods for determining the critical path. You can simply look at your network diagram and identify the longest path through the network — that is, the longest sequence of activities on the path. Look for the path with the longest duration in days, not the path with the most boxes or nodes. The Forward Pass/Backward Pass technique can also be used to identify critical activities by identifying the earliest and latest start and finish times for each activity.
You should also keep in mind that you will encounter network sensitivity if you have multiple critical paths. If the critical path is likely to change once the project begins, the project schedule is considered sensitive. The more critical the paths in a project, the more likely a schedule change will happen.
-
6. Update the Created Critical Path Diagram to Show Progress
As the project progresses, you will learn the actual completion times for each activity. This information can then be added to the network diagram (rather than continuing to use estimations). You can recalculate a different critical path by updating the network diagram as new information becomes available. You will also have a more accurate picture of the project’s completion date and will be able to tell if you are on track or falling behind
FAQs
What is Critical Path Software?
Critical path software is used to calculate the critical path in your project schedule automatically. Managers would have to manually calculate the time-consuming and complicated equation if they did not use the essential software. And, as we all know, time is one of a project’s three constraints, so it’s easy to see why critical path software has become popular in project management. Any opportunity to increase efficiencies moves the project closer to its goals and objectives.
Because critical path is such a specific technique, critical path software is usually associated with a larger project planning tool that organizes tasks, prioritizes the sequence of activities, and includes other features that contribute to the creation of the schedule.
What is a Crash Duration in a project?
The term ‘crash duration’ refers to the shortest amount of time that an activity can be scheduled for. It can be accomplished by directing more resources toward the completion of that activity, resulting in less time spent and, in many cases, lower quality of work because the premium is placed on speed. Crash duration is commonly modeled as a linear relationship between cost and activity duration; however, in many cases, a convex or step function is more appropriate.
What is PERT and how does it differ from a Critical Path Analysis?
A PERT chart, also known as an activity-on-arrow diagram, is a visual representation of your project’s schedule that shows the order of tasks and which can be completed concurrently. A PERT chart contains many of the same details as a critical path method, such as earliest and latest start dates, earliest and latest finish dates, and slack (or float) between activities.
The most significant distinction between the critical path method and PERT is in time estimation. Time variance is not taken into account in the critical path method. You’re estimating completion times based on best-guess estimates, which may change. With PERT, you place more emphasis on the most realistic completion time.
What is “float” in a project task?
Float, also known as slack, is a term that describes how long you can postpone a task before it disrupts the planned schedule and jeopardizes the project’s deadline. The critical path tasks have no float. You can calculate the float using different kinds of project management software. If an activity has a float greater than zero, it can be postponed without affecting the project’s completion time.
Are there any advantages of using Critical Path Software for analysis?
Knowing the critical path and having a tool to recalculate it as your schedule evolves throughout the project are critical to getting back on track when you’re behind schedule. More advantages of using critical path software include quick calculations to save time and effort, tracking progress to know if you’re behind, recalculating as the project schedule changes, keeping track of task dependencies, setting milestones and saving important dates, getting insightful data when planning tasks, and creating a schedule baseline for project variance.
In conclusion, Critical Path Analysis can be a powerful and flexible decision-making tool for large project managers because it is useful at various stages of project management, from initial planning or analyzing alternative programs to scheduling and controlling the jobs (activities) that comprise a project. Using critical path analysis also allows the manager to quickly investigate the effects of crash programs and anticipate potential bottlenecks that may arise as a result of shortening certain critical jobs. Finally, this method yields reasonable estimates of total project costs for various completion dates, allowing the manager to choose the best schedule. In this article, you can find examples of the critical path analysis that you can download and personally use for your own study.