16+ SAMPLE Analytical Business Report
-
Analytical Business Report
download now -
Analytical Business Report Outline
download now -
Analytical Assignment Business Report
download now -
Analytical Business Data Report
download now -
Analytical Business Case Report
download now -
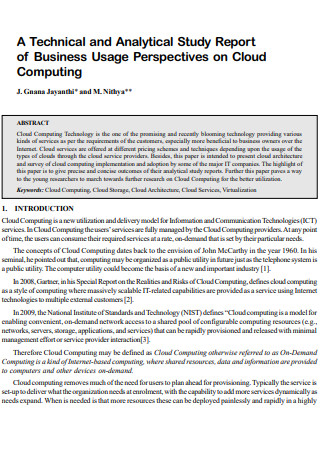
Technical Analytical Business Study Report
download now -
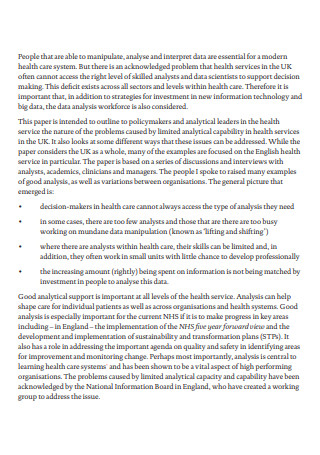
Health Analytical Business Report
download now -

Privacy Analytical Business Report
download now -

Analytical Business Final Report
download now -
Analytical Firm Business Report
download now -
Sample Analytical Business Report
download now -
Analytical Tool Business Report
download now -
Analytical Business Executive Report
download now -
Analytical Data Infrastructure Business Report
download now -
Consolidated Analytical Business Report
download now -
Analytical Business Report Example
download now -
Analytical Business Report in PDF
download now
FREE Analytical Business Report s to Download
16+ SAMPLE Analytical Business Report
an Analytical Business Report?
Benefits of Analytical Reports
How To Write an Analytical Business Report
FAQs
What is the format of an analytical report?
What is the definition of an analytical essay?
What is an analytical individual?
What Is an Analytical Business Report?
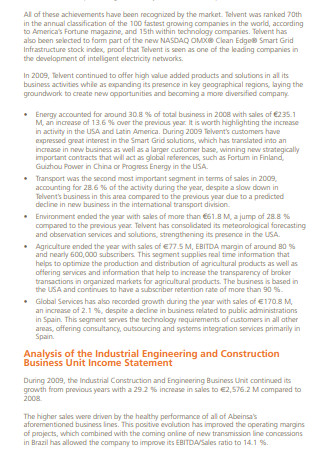
Analytical business reports assess a strategy or business procedure by utilizing relevant data to assist in making informed business decisions. Analytical business reports are a subset of business reports that estimate a specific issue or set of circumstances within the organization. Additionally, analytical business reports include recommendations for resolving the point or position of possibilities at hand. According to research, nearly 97 percent of respondents indicated that their organizations had implemented analytics. The three most desired objectives were reducing costs, increasing profitability, and improving risk management.
Benefits of Analytical Reports
Enterprises generate a wealth of data, and data analytics is the key to unlocking those insights. Data analytics can assist an organization in various ways, from tailoring a marketing message to an individual customer to identifying and mitigating business risks. Consider the following advantages of data analytics.
How To Write an Analytical Business Report
Now that we’ve defined an analytical business report and discussed some of the critical benefits of an analytical business report, we’ll look at how to write an analytics-style business report to improve overall business intelligence using modern and professional tools.
Step 1: Utilize electronic dashboards.
When defining “what is an analytical business report,” it’s critical to consider the most appropriate medium in terms of usability and presentation. A spreadsheet or a Word document can all be used to create an analytical report. However, these more traditional methods of report writing are frequently inefficient and time-consuming. While it is possible to structure data across various spreadsheets, the result is frequently more confusing than beneficial. You can access dynamic metrics and data in an easily digestible, actionable, and accurate format through an online dashboard. There will be no more sifting through reams of spreadsheets, no more haphazard data analysis and reporting methods. With digital analytical reporting, you can watch the insights unfold in real-time.
Step 2: Be vivacious.
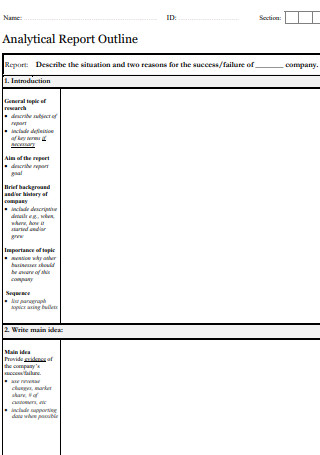
Traditional reports follow a rigid structure that makes editing difficult. Additionally, static reports have limitations. Typical analytical reports include a title page, a table of contents, an introduction, a methodology section, a body section, conclusions, and recommendations, as well as a bibliography. However, your structure will be significantly more straightforward and comprehensive with dynamic, interactive dashboard reporting software. As such, you can retain all of the conventional data you require, but the dynamism will provide data that you can use in real-time and drill deeper into with the swipe of a screen.
Step 3: Select the appropriate chart types.
Which aspect of analytical reporting is the most critical? Perhaps it’s selecting the appropriate chart type. Once you’ve made a conscious decision to work with dynamic analytical reports, the next step in the “how to write an analysis report” process is to select the appropriate chart type. A modern data report includes a plethora of interactive data charts and visualizations that you can leverage. You can improve communication and productivity by selecting the suitable types that accurately represent the information conveyed in your data analysis report. The most frequently used chart types in analytics reports are interactive bar charts, line charts, bubble plots, area charts, and maps. To assist you in selecting visualizations for your report, the following is a guide to choosing the most appropriate type of data visualization for your business.
Step 4: Adhere to best design practices.
When it comes to creating analytical reports, presentation is critical. Regardless of how powerful your dashboard software is, you will dilute your most vital organizational information without adhering to data analysis and reporting best practices, rendering it significantly less effective. When writing an analysis report design, a simple, concise layout with a well-balanced mix of visuals is the way to go. You must ensure that your dashboard provides brief answers to pertinent questions about your business’s performance for effective analytical reporting. Avoid cramming too many charts and widgets into your data analytics reports; this will only serve to dilute the value of your analytical information. Additionally, for maximum data analytics reporting success, adhere to a logical format that enables you and your users to extract actionable insights quickly. By including tables at the bottom of the dashboard, you can create a logical, analytical report format, as tables typically contain more information than charts, graphs, or comparable metrics.
Step 5: Utilize the appropriate KPIs.
There are multiple dynamic key performance indicators and numerous types of analytical reports available in the digital age. Due to the visually appealing and interactive nature of these KPIs, you can access a wealth of invaluable information, both historical and predictive, as well as real-time. To ensure that an analytical-style report format performs optimally, selecting the appropriate KPI template is critical to building your performance and business goals. When creating a business analytics report, you should consider the trends you want to uncover or benchmark and choose your key performance indicators accordingly. Concentrating on your primary business objectives will assist you in selecting appropriate dynamic KPIs – doing so will ensure that the initiatives you develop for the organization are adaptable, responsive, and innovative. By carefully selecting your key metrics, you gain the ability to identify strengths and weaknesses while also increasing the accessibility of your information to other stakeholders, both internal and external. This is a critical component of ensuring that the structure of an analytical report is constructed correctly.
Step 6: Provide easy access to your analysis report.
Remember, your business analytics report must always be available. Along with creating a visually appealing, logical design and format, your analytical data should always be accessible to the appropriate individuals within your organization whenever and wherever they require it. By utilizing a modern analytical report template, you can provide 24/7 access to your company’s most critical KPI dashboards, as employees can log in and extract insights from various devices, including smartphones and tablets. The primary goal of an analytical report template is to boost internal business intelligence while arming everyone with the data they need to perform better – and this limitless level of accessibility will accomplish that goal.
FAQs
What is the format of an analytical report?
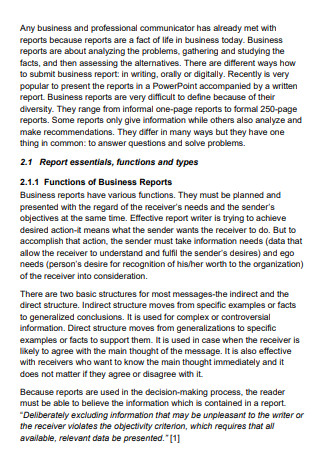
Analytical reports are a type of technical business writing that conveys information about a solution to a problem. The reports are well-documented and synthesize a wealth of data to reach educated conclusions.
What is the definition of an analytical essay?
An analytical essay requires you to make an argument or claim about the subject you are analyzing. Analytical reports typically focus on the writing process – for example, how specific themes are presented in a story. It is essential because it will communicate to your reader precisely what you’re attempting to accomplish and the point you’re trying to make. This way, the readers will be able to follow the essay’s main points without becoming confused.
What is an analytical individual?
Before making a significant decision, an analytical person wants to gather and consider all available information. Even when faced with few choices, they will frequently seek guidance from numbers or data rather than making an ad hoc choice. Analytical abilities refer to the capacity to deconstruct a problem, weigh the benefits and drawbacks, and reach logical conclusions. Employees with these skills assist businesses in overcoming obstacles or identifying issues before they become problems. Each position necessitates analytical abilities.
The digital period has altered the way we interact with our environment. Businesses across all industries now can collect, curate, and interpret data in ways that enhance intelligence and speed up success. In this brave new world, analytical reports have become indispensable tools for gaining and maintaining a competitive edge in the digital landscape. It’s easy to see how these types of reports could be applied across industries, as they provide actionable insights into various departments, activities, and internal functions. By utilizing business intelligence dashboard tools, you can stay ahead of the curve in today’s market while lowering operational costs and propelling your organization forward from the competition, one data-driven initiative at a time. Combining an online data visualization tool with the appropriate analytical business report examples enables you to track your company’s specific and holistic performance and improve your decision-making.