50+ Sample Education Questionnaire Templates
Create appropriate education questionnaires with the help of the samples below.
-
Academic Freedom Questionnaire
Measure differences in opinions regarding academic freedom using this questionnaire.
-
Academic Personnel Questionnaire
Use this questionnaire sample to determine whether a particular candidate is eligible for benefits.
-
Academic Progress Questionnaire
Identify the challenges encountered by students through a questionnaire.
-
After-School Student Questionnaire
Assess a child’s knowledge in nutrition and physical activity using the questionnaire provided.
-
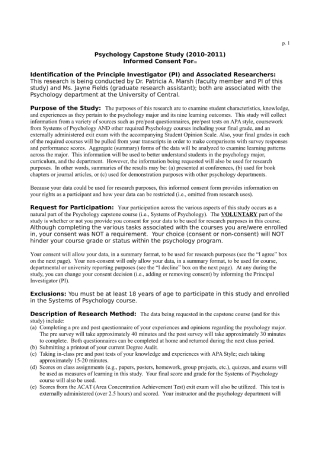
Capstone Study Questionnaire
Collect data for your capstone study with the help of a questionnaire.
-
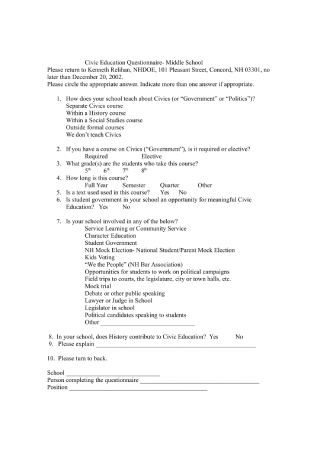
Civic Education Questionnaire
Learn about the civic views of your audience through a questionnaire.
-
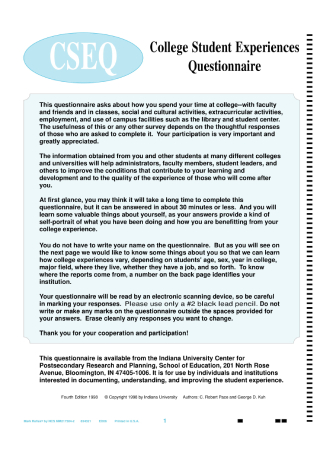
College Student Experiences Questionnaire
See how students spend their time at college with the use of a questionnaire.
-
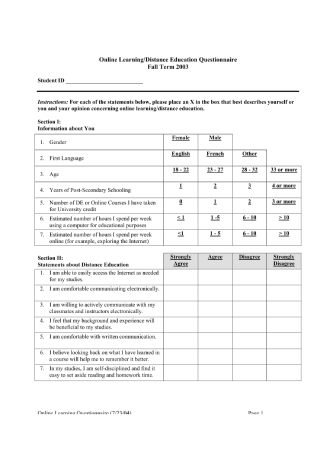
Distance Education Questionnaire
Gather useful insights concerning online learning and distrance education with a questionnaire.
-
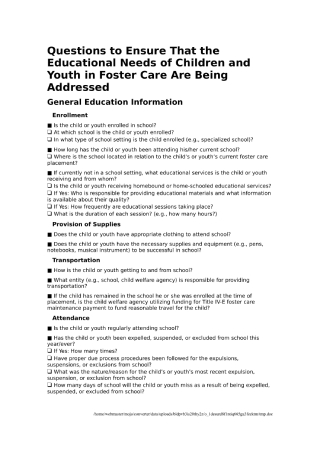
Educational Needs Questionnaire for Foster Youth
Design a questionnaire that will help you meet the educational needs of foster children.
-
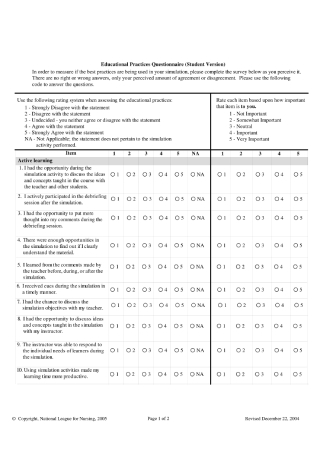
Educational Practices Questionnaire
Ensure that the best educational practices are used in a simulation through a questionnaire.
-
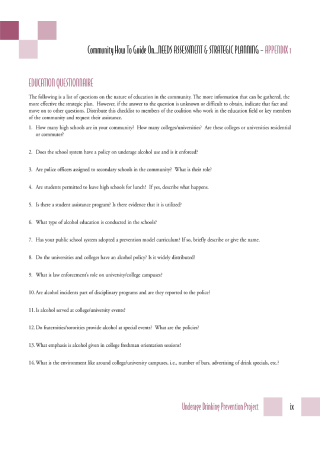
Education Questionnaire for Needs Assessment
Improve the training methods provided by the institution using a questionnaire.
-
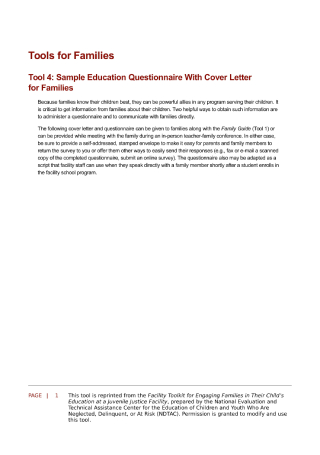
Education Questionnaire with Cover Letter for Families
Get relevant information from families about their children using a questionnaire.
-
Elementary and Middle School Admin Questionnaire
Ask adminstrators about the status of students of certain year levels with a questionnaire.
-
Elementary School Questionnaire
Improve school facilities and programs with the help of a questionnaire.
-
Health Education School Questionnaire
Assess health education across the school district with a questionnaire.
-
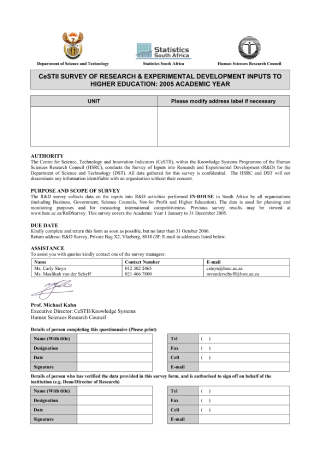
Higher Education Sector Questionnaire
Garner inputs on the research and development activities of an institution using this sample.
-
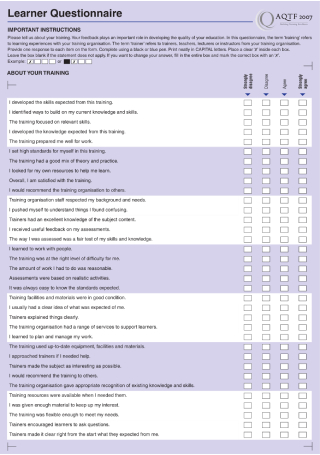
Learner Questionnaire
Improve the organization’s quality of education with the feedback acquired from a questionnaire.
-
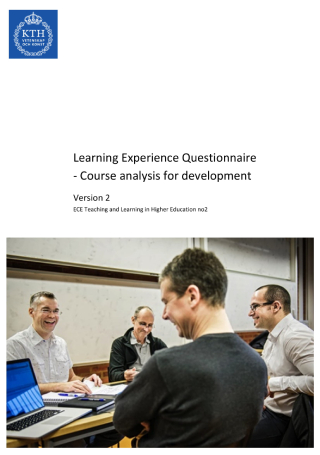
Learning Experience Questionnaire
Plan future teachning and learning activities effectively with the help of a questionnaire.
-
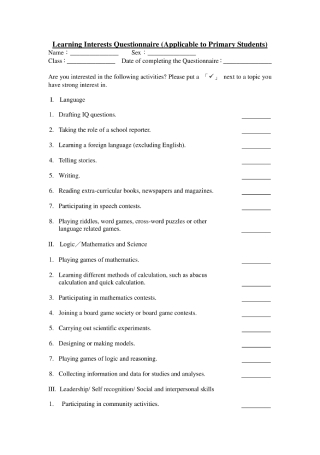
Learning Interests Questionnaire
Respond to the individual needs and preferences of students through a questionnaire.
-
Learning Orientation Questionnaire
Study the learning differences of individuals with the use of a questionnaire.
-
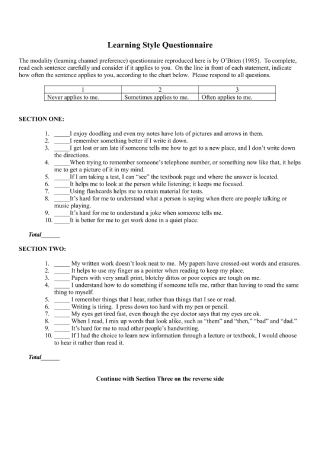
Learning Style Questionnaire
Develop better study habits by identifying your learning strengths with a questionnaire.
-
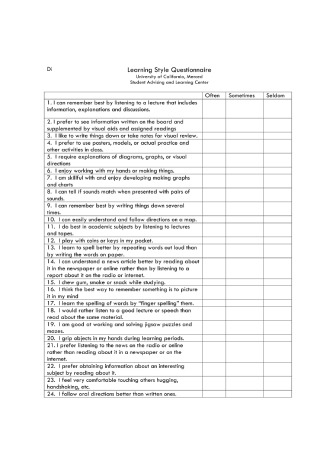
Learning Style Questionnaire for University Students
Understand the learning styles of students through the use of a questionnaire.
-
Medical School Graduation Questionnaire
Enhance your school’s medical education and student support services through this sample.
-
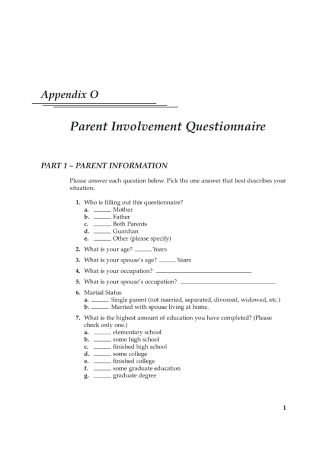
Parent Involvement Questionnaire
Get involved with your child’s academic activities with the help of a questionnaire.
-
Previously Disqualified Student Questionnaire
Evaluate a student’s readmission in the course by using a questionnaire.
-
Questionnaire for College Students
Gather valuable input from college students by utilizing a questionnaire.
-
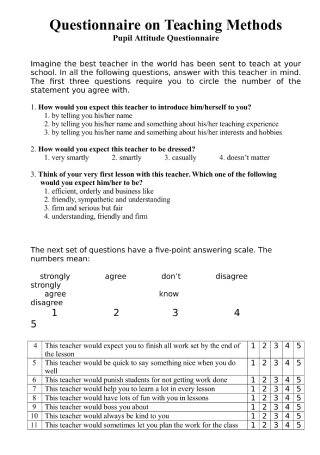
Questionnaire on Teaching Methods
Refine your teaching methods through the feedback garnered from a questionnaire.
-
School and Program Questionnaire
Compare how education is provided in different schools and programs using this sample.
-
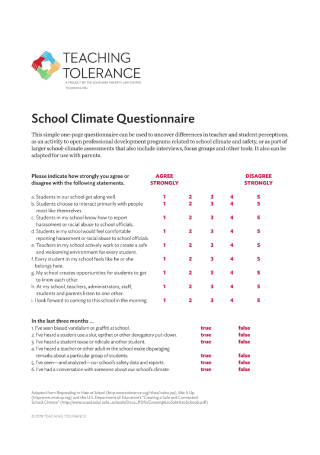
School Climate Questionnaire
Uncover differences in teacher and student perceptions through the use of a questionnaire.
-
School Life Questionnaire
Examine the outcomes of schooling by designing a questionnaire for this purpose.
-
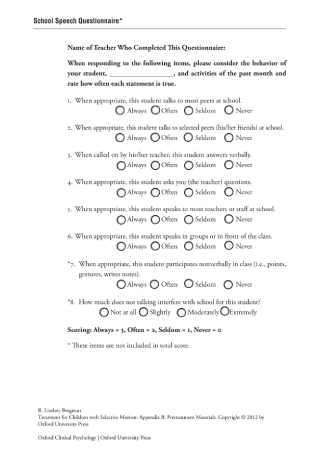
School Speech Questionnaire
Assess a student’s communication skills by answering the questionnaire provided.
-
School Survey Questionnaire
Use this questionnaire to better illustrate the similarities and differences between schools.
-
Science Motivation Questionnaire
Analyze how students really think and feel about their science courses using a questionnaire.
-
Self-Report Questionnaire of Academic Achievements
Conduct a background check on a candidate’s academic achievements through this sample.
-
Student Adaptation to College Questionnaire
Measure the effectiveness of a student’s adaptation to college with the use of a questionnaire.
-
Student Dropout Questionnaire
Reduce the rate of dropouts by determining the causes of such with a questionnaire.
-
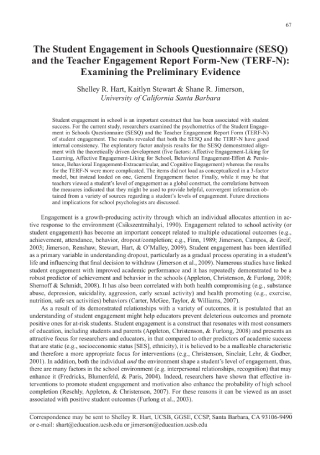
Student Engagement in Schools Questionnaire
Examine the psychometrics of student engagement in schools with a questionnaire.
-
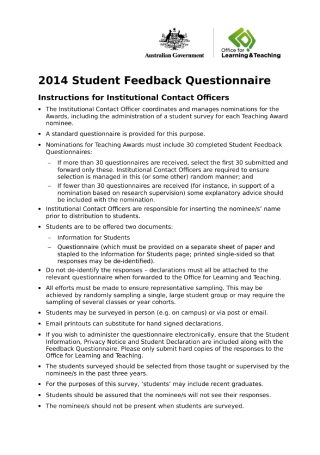
Student Feedback Questionnaire
Collect course evalutions and teacher reviews from students using a feedback questionnaire.
-
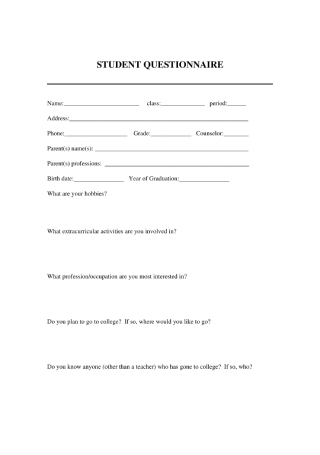
Student Profile Questionnaire
Get to know each student enrolled in the institution with the help of a profile questionnaire.
-
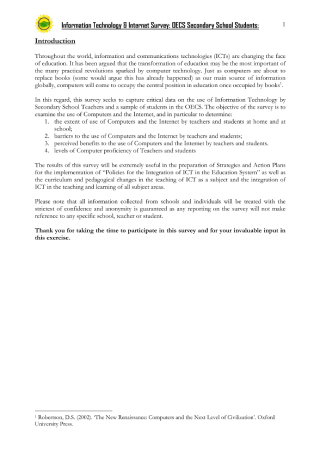
Student Questionnaire on IT and the Internet
Determine the extent of computer and internet usage by teachers and students with this sample.
-

Student Questionnaire on Target Groups
Gain insightful data from different student groups by using the questionnaire provided.
-
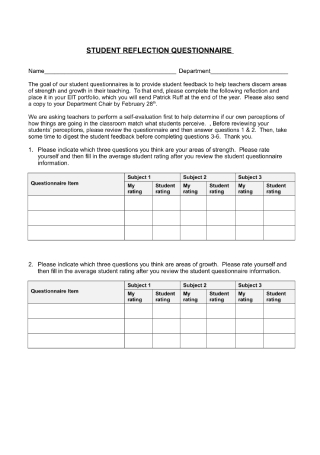
Student Reflection Questionnaire
Get students thinking about their education with a reflection questionnaire.
-
Student Satisfaction Questionnaire
Make use of a questionnaire to obtain feedback about different aspects of the school.
-
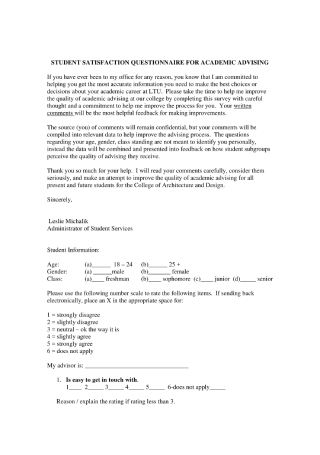
Student Satisfaction Questionnaire for Academic Advising
Help students make the best decisions for their academic career through a questionnaire.
-
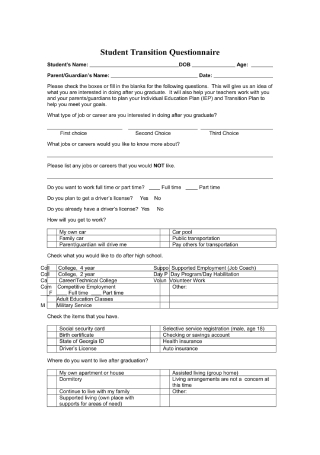
Student Transition Questionnaire
Assist students in planning out their future by using a questionnaire as your guide.
-
Student Well-Being Process Questionnaire
Refer to this sample to assess the well-being of students based on different psychological concepts.
-
Study Skills Assessment Questionnaire
See the areas where you excel in or struggle with through this assessment questionnaire.
-
Teacher Questionnaire on the Use of ICT
Study the frequency, quality, and diversity in learning using the given questionnaire.
-
Technology Implementation Questionnaire for Student Learning
Dive into the classroom processes that do or do not integrate technology through this sample.
-

Test Anxiety Questionnaire
Determine if a student experiences a mild or severe case of test anxiety using this questionnaire.
-
Teacher Education Questionnaire Template
download now
What Is a Questionnaire?
A questionnaire is an instrument used in research for collecting information from a respondent. It is comprised of a series of questions designed to obtain valuable data for researchers to analyze. Respondents are either asked to formulate their own answer based on the question provided or to choose an answer from a given set of options. These questions may cover facts, behaviors, preferences, and even one’s attitude toward a subject. But in order for you to get the best answers, you need to make sure you’re asking the right questions.
The Difference Between Surveys and Questionnaires
You might have heard these two terms being used interchangeably. What many people, even professional researchers, fail to recognize is the distinctive characteristics that differentiate one from the other.
The major difference between a sample survey and a questionnaire is that the latter refers to a written set of questions about a particular topic, while the former pertains to the actual process of collecting and analyzing the data obtained from those set of questions. It doesn’t matter how general or personal the subject may be, questionnaires can be a key part of a survey to help researchers get the information they need from their audience. A questionnaire doesn’t have to be delivered in the form of a survey, but a survey always consists of a questionnaire to carry out its purpose. As for cases where questionnaires are used as a stand-alone tool, these may be used for building an email list, accepting payments, or gathering personal accounts for a business or academic project.
The Purpose of an Education Questionnaire
Questionnaires are often used in an academic setting for different reasons. The questionnaire may be designed to better understand the behavior of students, examine the relationship between educators and learners, look into the school’s culture, or improve parental involvement and staff satisfaction. Education plays a fundamental role in our daily lives, so it’s only practical to make sure everyone’s journey is as fulfilling as possible. To find out how you can make the most of this instrument, here’s how you can use a questionnaire to dig deeper into a school’s education system.
How to Create an Effective Questionnaire
Perhaps the most challenging part of developing a questionnaire is having to formulate questions that accurately measure the opinions, experiences, and behaviors of an audience. While high response rates seem like a good indicator of a successful survey questionnaire, the time and effort invested in the questionnaire’s creation will all be wasted if the information acquired is generated from a set of ambiguous and biased questions. Given how complicated questionnaire design can be, you may want to keep the following points in mind.
Questionnaires are perfect for gathering feedback from students, teachers, and administrators for fulfilling a successful educational experience. While they may take a significant amount of time and effort to prepare, a good education questionnaire should help increase your chance of uncovering meaningful findings for your study.