13+ Sample Survey Analysis Report
-
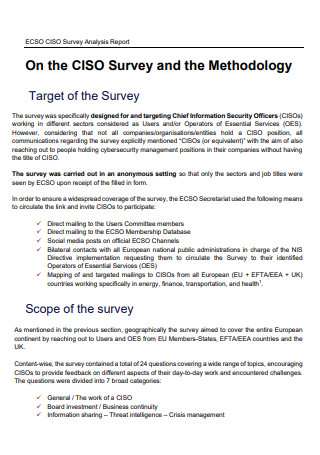
Survey Analysis Report Template
download now -
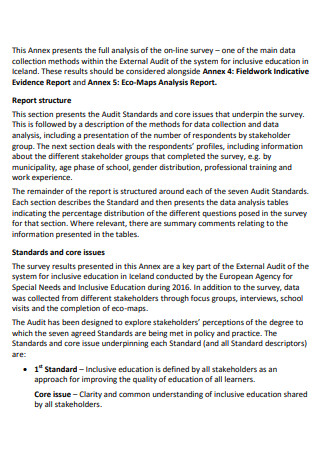
Online Survey Analysis Report
download now -
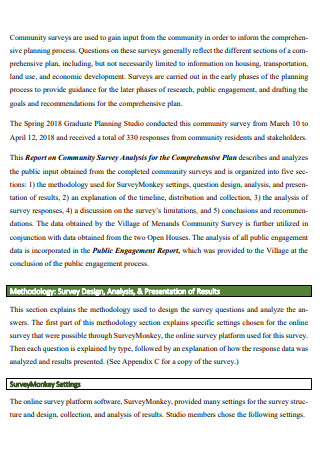
Community Survey Analysis Report
download now -
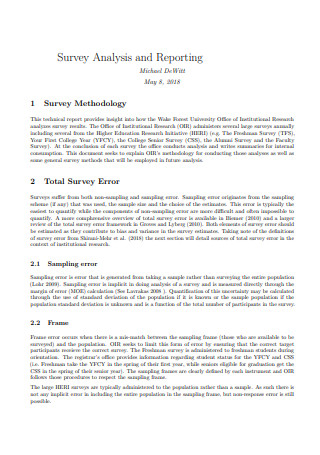
Basic Survey Analysis and Reporting
download now -
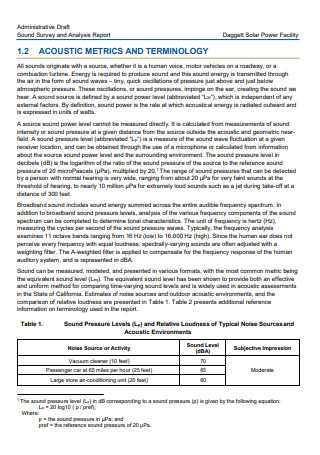
Sound Survey and Analysis Report
download now -
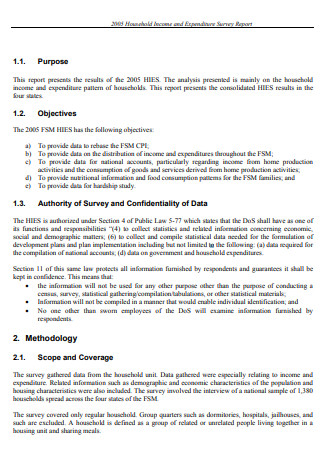
Income and Expenditure Survey Analysis Report
download now -
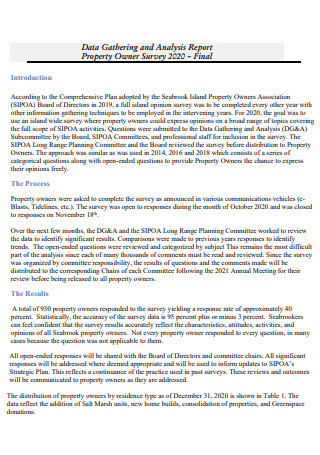
Property Owner Survey Analysis Report
download now -
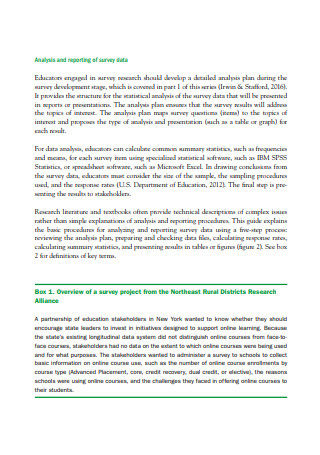
Survey Data Analysis and Reporting
download now -
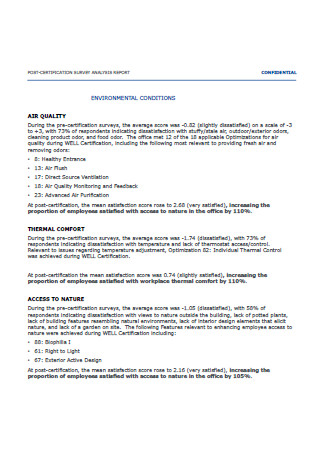
Post Certification Survey Analysis Report
download now -

Membership Survey Analysis Report
download now -
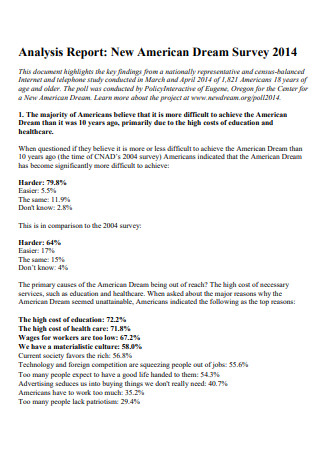
Survey Analysis Report Example
download now -
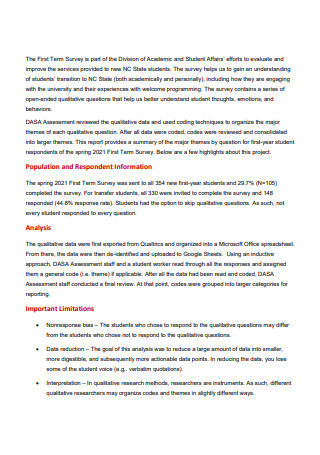
Survey Qualitative Analysis Report
download now -
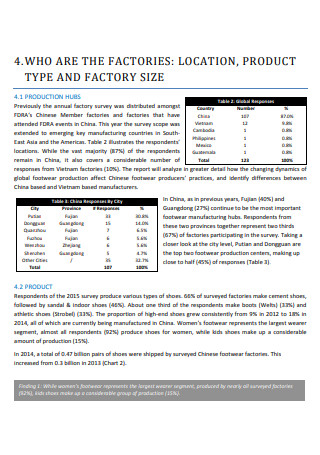
Factory Survey Analysis Report
download now -

Air Quality Survey Analysis Report
download now
These questions have a broad range, covering different topics, with people inquiring through various methods. For organizations that use surveys to their advantage, the questions must be strategically designed and structured for the results to be accurate. When creating the survey, consider the goals of the survey, the process of application, and the decisions that follow once the survey results are available. Afterwhich, the organization produces a survey analysis report. What is a survey analysis report, and what is its purpose in the operations of a business? The article presents valuable information about the report, including its definition, components, and how-to guide. A dedicated section also answers frequently asked questions about the document stemming from various industries and sectors.
What Is a Survey Analysis Report?
A survey analysis report provides a better visual representation of the gathered data. It is a document that conveys critical information to the readers. The business must emphasize and give special attention to the survey analysis report as it can make or break other processes and operations. After completing the survey process with all the essential information and data from target groups, the next step is the survey analysis report. It contains all relevant detail from the survey and data analysis through a creative and comprehensive data story. The document serves as a tool to persuade readers to look over the information regarding the survey, whether it is to secure funds or to represent relevant information. Data without appropriate visualizations will find it difficult to communicate significant insight. Provide the best way to communicate survey data that complements a story. The best way to express a survey analysis report is using a creative and well-organized narrative containing visual representations to deliver clarity.
According to the United States Census Bureau, there are more than 130 surveys and programs a year they execute. The surveys include the nation’s two largest surveys, including the household survey, the American Community Survey, and the business survey, Quarterly Services Survey. These surveys range from opinions from different target groups that influence different sectors and industries.
Tips to Analyze Survey Data Results
Before an individual or a team can write a comprehensive survey analysis report, they must first collect and analyze the results from the survey questionnaire. Getting the right amount of information is already hard as it is, and providing inaccurate data analysis makes things worse. Below are helpful tips that can help with analyzing data results.
How To Write a Survey Analysis Report
If a researcher presents data to stakeholders, executives, and business partners, there must be a full report of the findings you have from the data analysis. It is necessary to keep track of all the information that you currently have, maintaining all past and future records for reference. It is so you will not waste time duplicating research and lessen the number of errors. Below are helpful steps to write a survey analysis report.
-
1. Indicate the Outcome of the Survey
For the audience to focus on the specific outcome you wish to relay after reading the document, start to explain the survey outcome in great detail. The survey outcome comes in the middle of the survey analysis report, but it is a valuable roadmap when writing the report, especially if it is lengthy. The section describes the probable scenarios if stakeholders are on board after reading the survey results. The ideas for outcomes consist of new product offers due to critical customer feedback, price increases or price adjustments to increase business revenue, and exploring new markets for expansion. Guarantee that collected data supports the outcome and avoid ideas that do not stem from the results of the report.
-
2. Write the Research Summary
The next step is to summarize the research findings. Indicate all the notable outcomes and all the information that shows the correlation with previous research on record. The research summary becomes an essential part of the survey analysis report that the readers focus on as it contains a brief description of all the essential details of the document. In writing the research summary, ensure that it is no longer than a single page. For readers to find it easier to read, indicate headers before paragraphs as a guide through the contents.
-
3. Draft a Rough Report Outline
The average length of a survey analysis report ranges from eight to ten pages. Therefore, a researcher must find a way to make the contents concise and comprehensive, highlighting information that the stakeholders need to know. The outline consists of an introduction that sets the stage for the report. It also includes a summary detailing the key findings and elements of the research. The methodology section explains the research process. The results section describes the data from research, while the outcome section analyzes the results according to organizational goals and objectives. Finally, the limitations and conclusion describe the research oversights for future research and a summary of the survey analysis.
-
4. Select a Layout To Use
A survey analysis report can be in landscape or portrait format, depending on the choice of the researcher. It is ideal to use a portrait format when the report focuses on text elements. It is also best to avoid entire pages for images or infographics as it takes away the space for necessary text-based information. A researcher should utilize the landscape format if the report aims to be design-heavy. It means that the report consists of high-quality images, charts, graphs, and infographics as text-based content is best set on the sides or below these visual elements.
-
5. Indicate the Methodology and Limitations of Research
The methodology details the procedures and processes of conducting the research. It also indicates the participants and the types of tests that the researchers used. The researcher can indicate a pie chart or line graph to represent and communicate the data. Use as much detail as possible as readers will want to know the research outcomes. Indicate the number of respondents, selection method, and demographical data. Describe the process of selection survey questions and the test selection. The limitation section sets up future research. It also provides future researchers to continue the study or correct mistakes in the present survey.
-
6. Indicate Appendices as Necessary
In cases where the report cannot hold all the data used for the research, the truncated versions of the graphs, charts, and tables that are present in the document must be a part of the appendix section in their raw forms. Throughout the survey analysis report, reference the appendix in order for the reader to review the information and have a better understanding of the content.
FAQs
How important is a survey report?
A survey report is essential to many businesses and organizations that provide solid and factual numbers, deliver essential benchmarks, uncover precise data, and give an encouraging voice to customers.
Which tools can be used for data analysis?
There are different types of data analysis tools. The most common of all is Microsoft Excel. Aside from Excel, applications like KNIME, SAS, Python, and RapidMiner.
What is the best data analysis method?
Depending on the type of data, various data analysis methods will help arrive at the most accurate results. For qualitative research, content, discourse, and narrative analysis are useful. For quantitative data, researchers use regression, factor, and cohort analysis.
Survey analysis reports are relevant in different organizations as it relays vital information about target markets, including trends and feedback. Businesses must conduct surveys regularly, whether it is monthly, quarterly, or annually. Research surveys allow organizations to collect honest and critical feedback, responses, and opinions from consumers and clients and utilize the information to improve the business. Start conducting surveys to the target market and perform data analysis to produce reliable and accurate information. Afterward, construct a detailed survey analysis report, and choose from the 13+ SAMPLE Survey Analysis Report in PDF from the article above.
