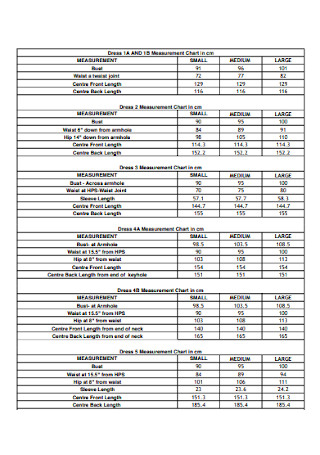
Measurement Chart Samples
-
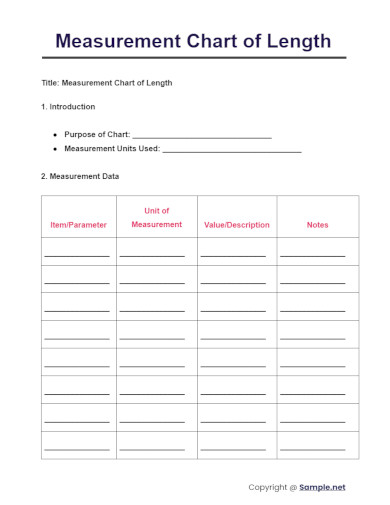
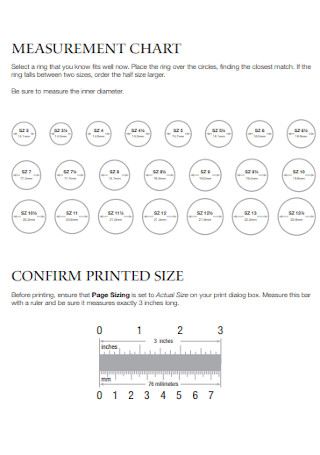
Measurement Chart of Lenght
download now -
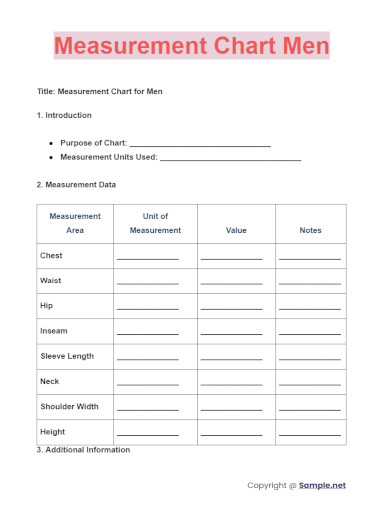
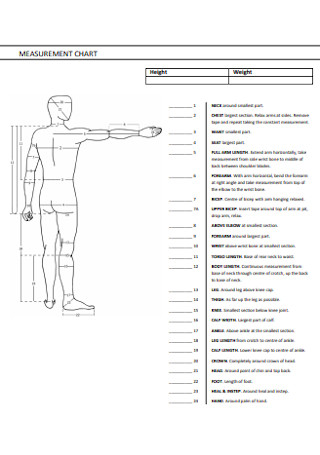
Measurement Chart Men
download now -
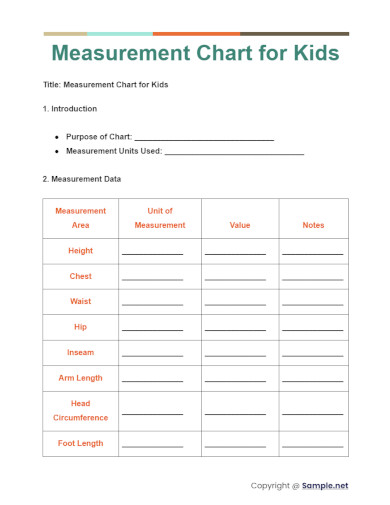
Measurement Chart for Kids
download now -
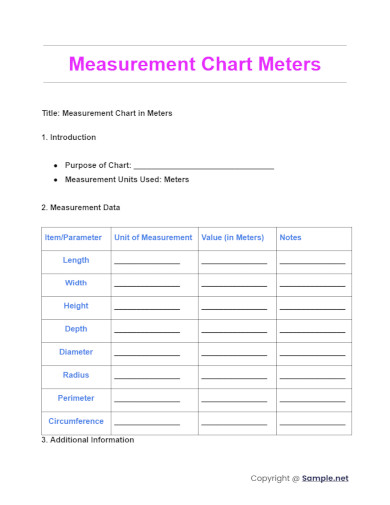
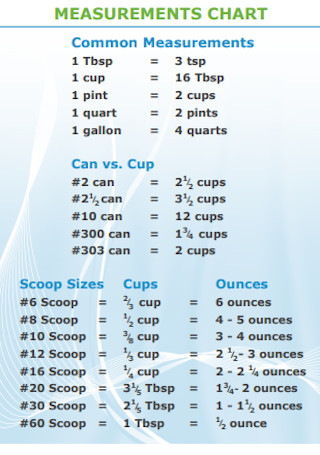
Measurement Chart Meters
download now -
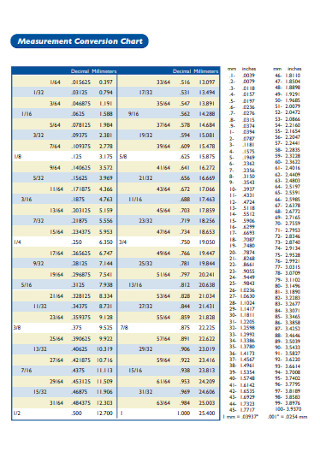
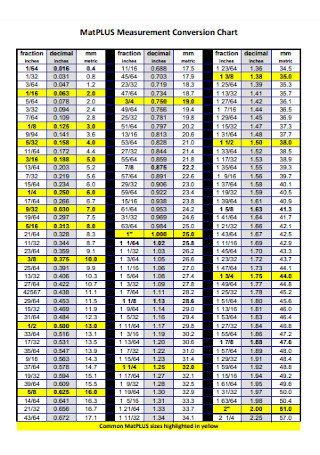
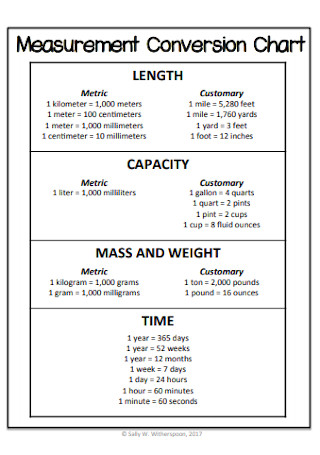
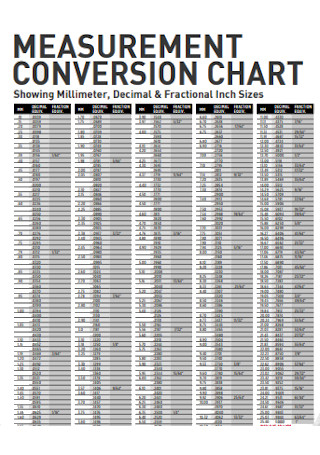
Measurement Conversion Chart
download now -
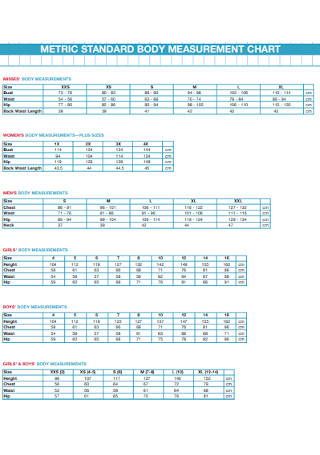
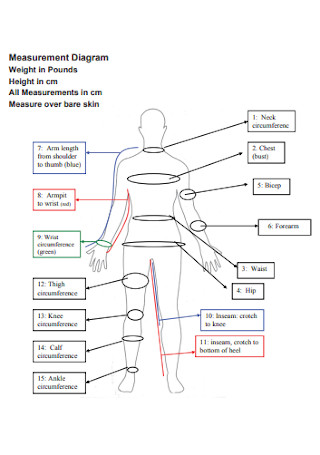
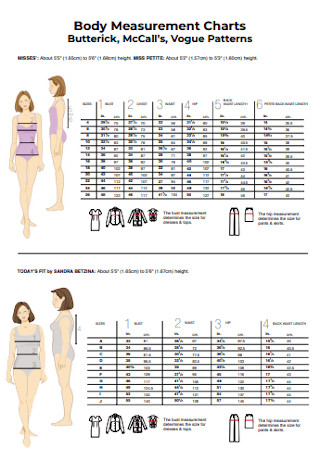
Body Measurement Chart
download now -
Measurement Chart Format
download now -
Centimeter Measurement Chart
download now -
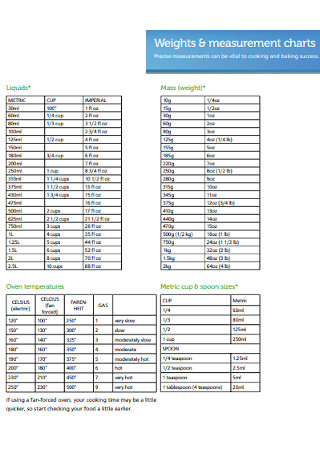
Weights and Measurement Chart
download now -
Sample Measurement Chart
download now -
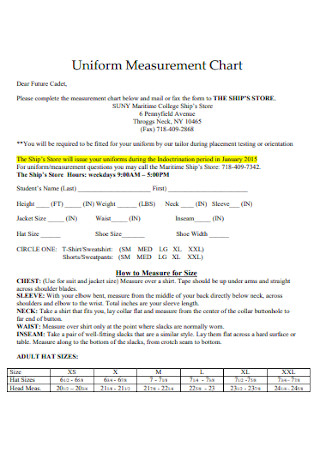
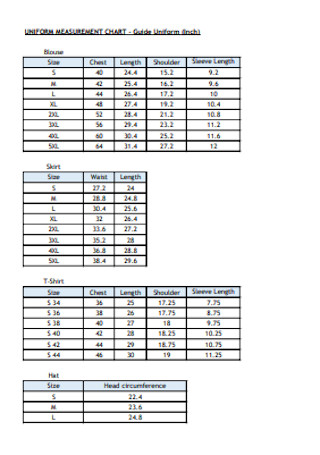
Uniform Measurement Chart
download now -
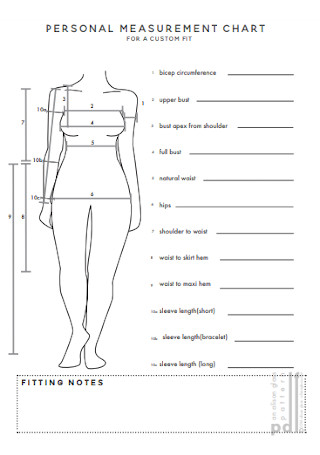
Sample Personal Measurement Chart
download now -
Measurement Chart Template
download now -
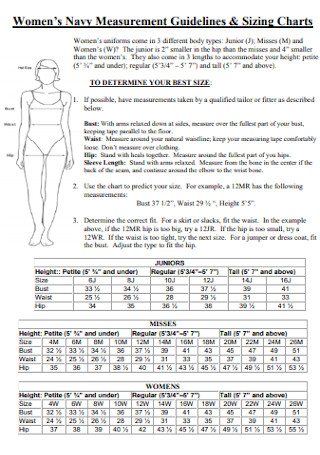
Womens Navy Measurement Chart
download now -
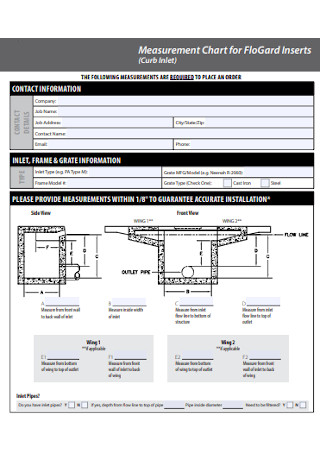
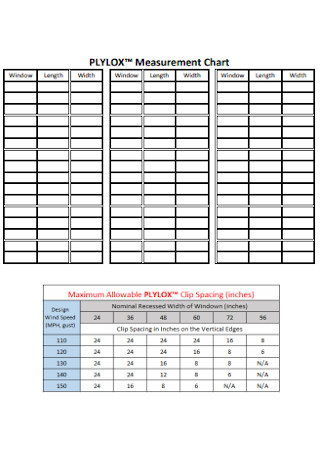
Measurement Chart for FloGard Inserts
download now -
Measurements Size Chart
download now -
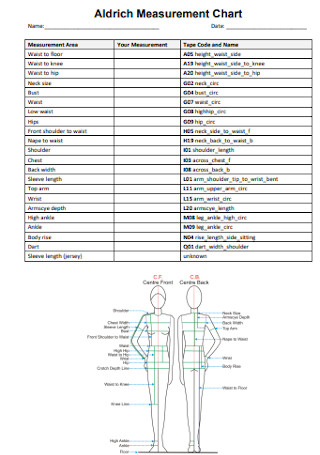
Aldrich Measurement Chart
download now -
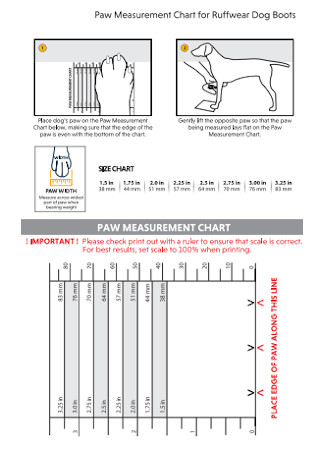
Paw Measurement Chart for Dog Boot
download now -
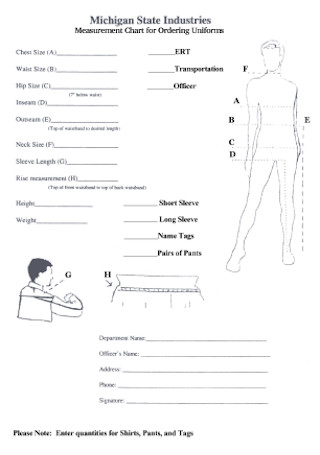
Measurement Chart for Ordaring Uniforms
download now -
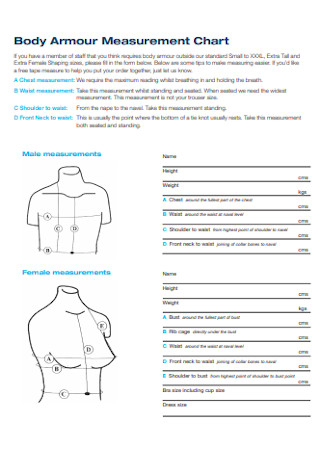
Body Armour Measurement Chart
download now -
Sample Measurement Conversion Chart
download now -
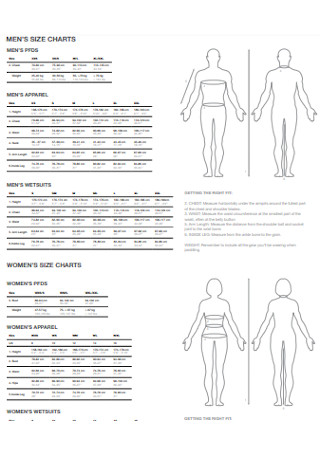
Mens Measurement Size Chart
download now -
Standard Measurment Chart
download now -
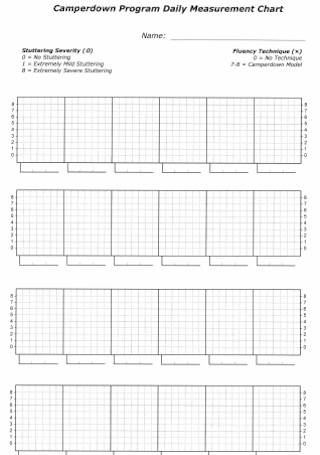
Program Daily Measurement Chart
download now -
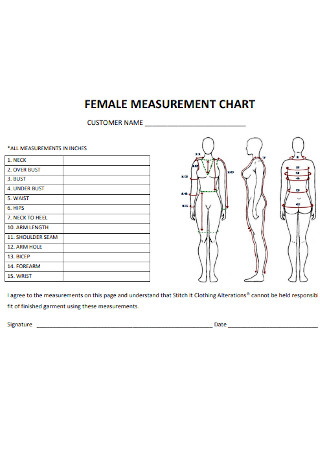
Female Measurment Chart
download now -
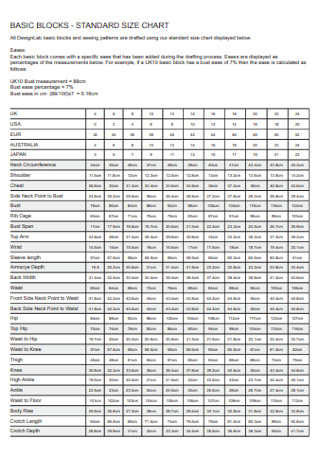
Basic Measurement Chart
download now -
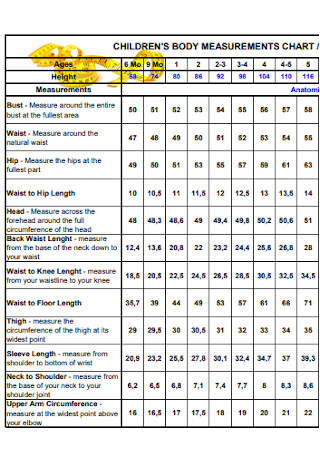
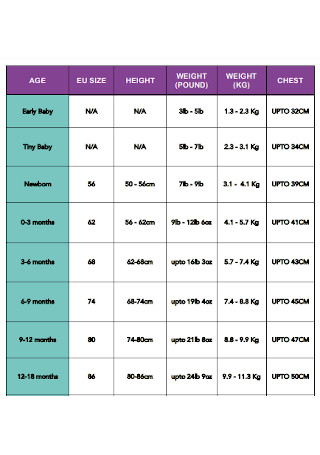
Childrens Body Measurement Chart
download now -
Measurement Conversion Chart Template
download now -
Simple Measurement Chart
download now -
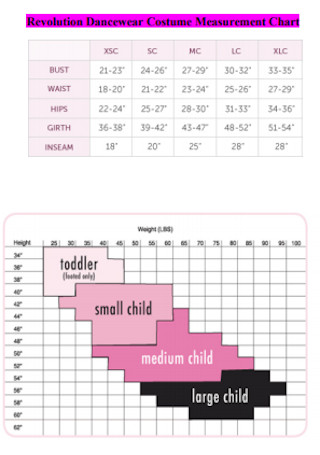
Dancewear Costume Measurement Chart
download now -
Weight in Pounds Measurement Chart
download now -
Formal Measurement Chart
download now -
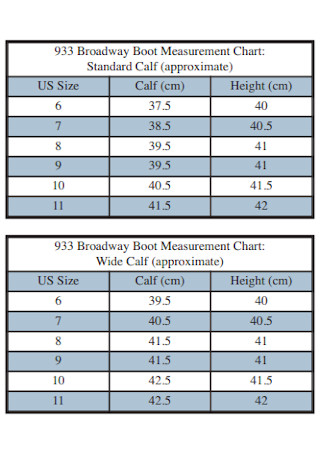
Broadway Boot Measurement Chart
download now -
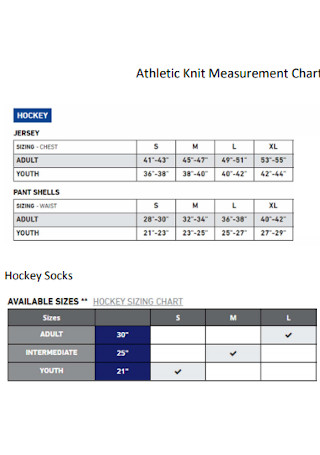
Athletic Knit Measurement Chart
download now -
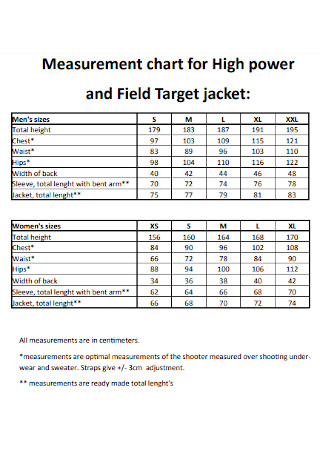
Measurement Chart for High Power
download now -
Personal Measurement Chart Example
download now -
Printable Measurement Chart
download now -
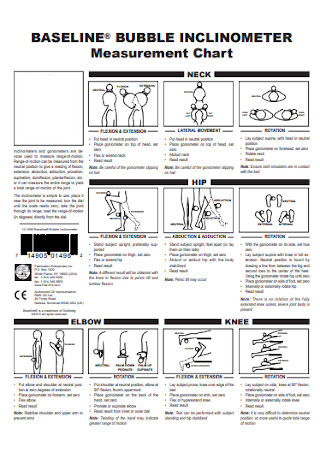
Inclinometer Measurement Chart
download now -
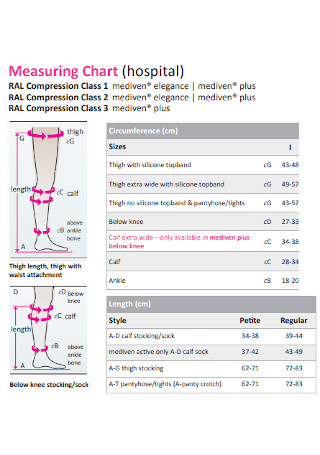
Hospital Measuring Chart
download now -
Measurement Conversion Chart Example
download now -
Body Measurement Chart Template
download now -
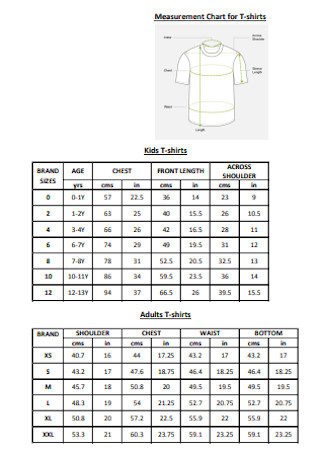
Measurement Chart for T-shirts
download now -
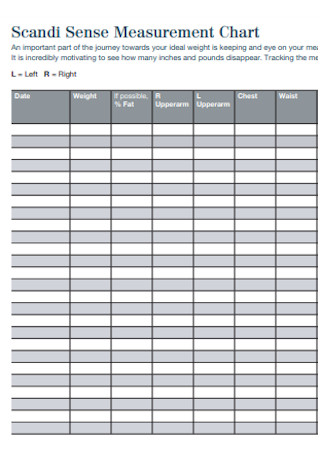
Scandi Sense Measurement Chart
download now -
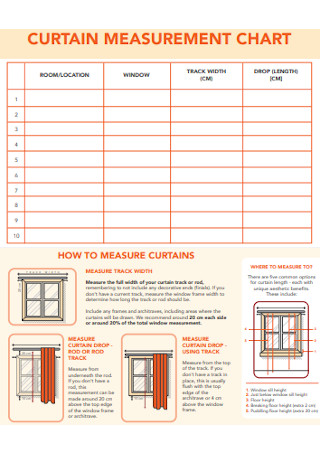
Curtain Measurement Chart
download now -
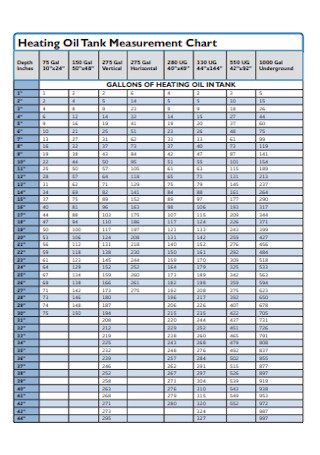
Oil Tank Measurement Chart
download now -
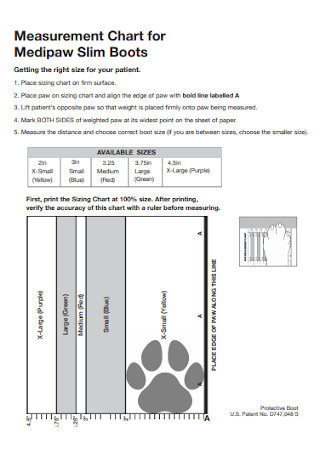
Medipaw Slim Boots Medipaw Slim Boots
download now -
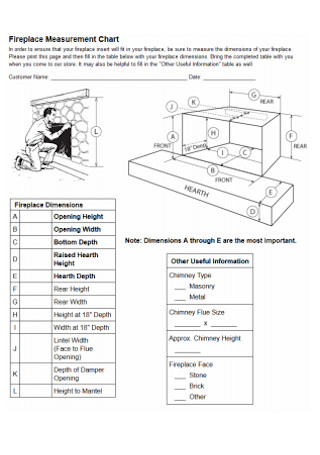
Fireplace Measurement Chart
download now -
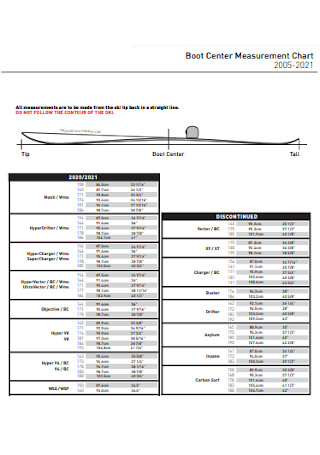
Boot Center Measurement Chart
download now -
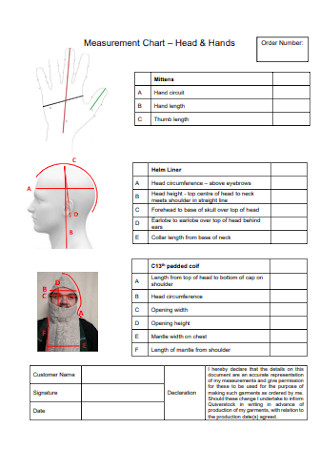
Hands and Head Measurement Chart
download now -
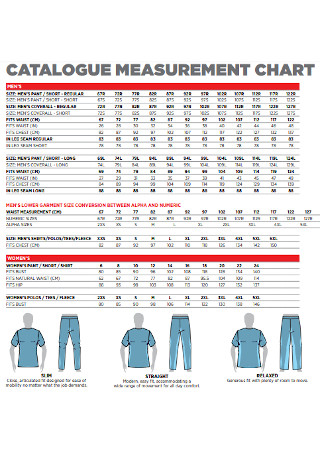
Catalogue Measurement Chart
download now -
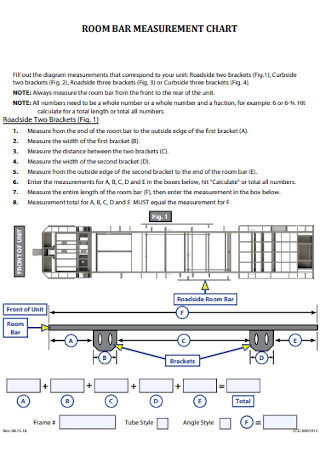
Room Bar Measurement Chart
download now -
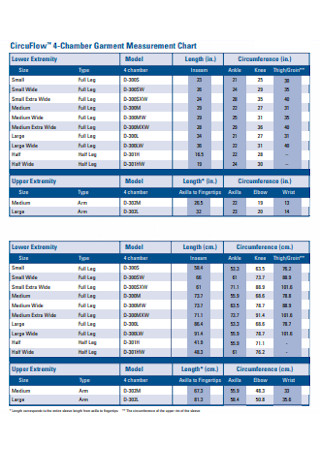
Chamber Garment Measurement Chart
download now -
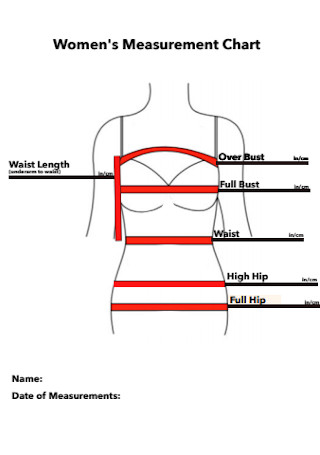
Sample Womens Measurement Chart
download now -
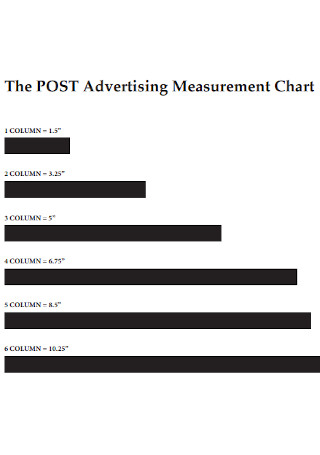
Post Advertising Measurement Chart
download now
FREE Measurement Chart s to Download
Measurement Chart Format
Measurement Chart Samples
What is Measurement Chart?
Common Uses of Measurement Charts
What Are the Basic Parts of a Measurement Chart?
How to Make a Measurement Chart
What are the basic units of measurement?
What are the types of measurement scales?
What is a metric conversion chart?
What Are the 5 Major Types of Measurements?
What Are the 10 Basic Units of Measurement?
What Is a Measuring Chart?
How Do I Read Measurements?
What Are the Four Basic Measurements?
What Are the 7 Metric Measurements?
How Should You List Measurements?
How Do I Read Measurements?
What Are All the Measurement Symbols?
What Is the Easiest Way to Measure?
What Is the Unit of Measurement for Length?
What Is the Smallest Unit of Length?
What Is the Basic Unit for Measuring Distance?
Download Measurement Chart Bundle
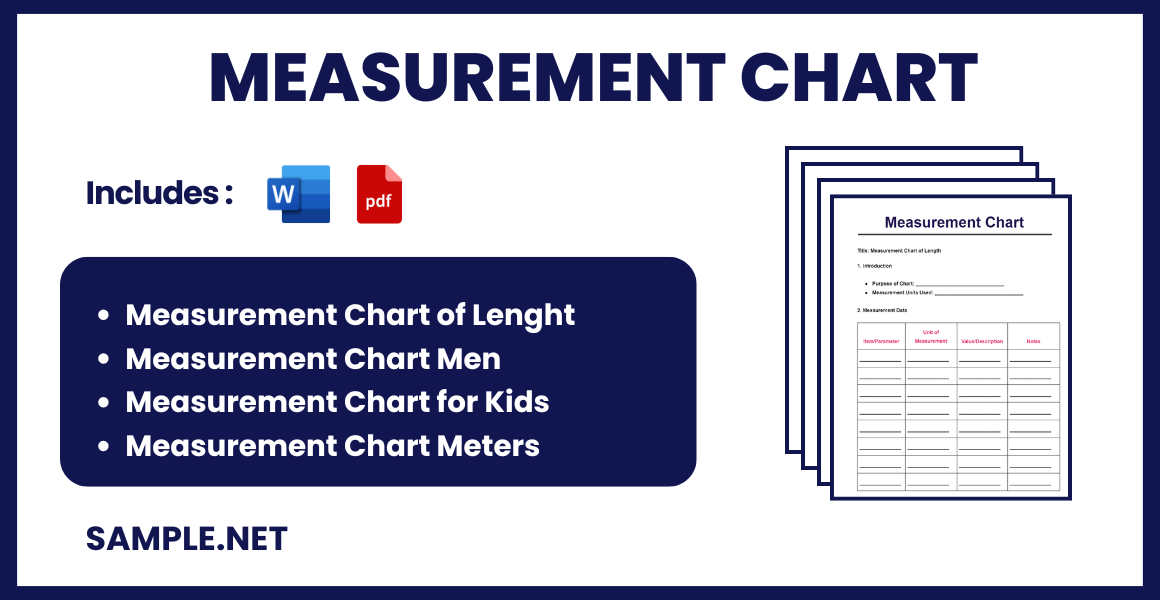
Measurement Chart Format
Title: Measurement Chart for [Specific Use]
1. Measurement Criteria
- Item/Parameter
- Unit of Measurement
2. Table of Measurements
| Item/Parameter | Unit of Measurement | Value/Description |
|---|---|---|
| Parameter 1 | Unit 1 | Value 1 |
| Parameter 2 | Unit 2 | Value 2 |
| Parameter 3 | Unit 3 | Value 3 |
3. Notes
- Additional Information
- Clarifications
What is Measurement Chart?
A Measurement Chart is a visual tool used to record and compare different sets of data, such as weights, lengths, or other metrics. It helps in tracking changes, identifying trends, and making informed decisions. Measurement Charts are commonly used in various fields like health, science, and business for effective data management and analysis.
According to Statista’s research survey, the worldwide apparel market was expected to increase up to $1.5 trillion in 2020.
Meanwhile, Chron reported that flight attendants must be around 5 feet and 3 inches up to 6 feet and 1 inch tall. That way, they are tall enough to handle the overhead bin but not too tall that they need to crouch inside the plane.
Why Is a Measurement Chart Important?
Measurement charts are important so you won’t measure things wrongly. For example, it is a bad idea to use a weight chart if your goal is to measure your height. And when you need to convert length from inches to centimeters, you need another chart for that too. As long as the measurement chart conveys a precise unit of measurement and data, rest assured, it will be a useful guide for reference. And basing from charts is much easier than having to memorize all sorts of measurements in the first place, especially when there are lots of examples.
Also, measurement charts are essential for various functions. You can measure your body, a liquid, apparel, and so much more. Hence, its function is not only limited to body measurements. And if you are over the conventional tabular format of such charts, you can also be creative by adding shapes, colors, and other figures to make more detailed charts. What matters most is that you love the output of the chart, it is easy to understand, and that it contains all correct measurements, to begin with.
Common Uses of Measurement Charts
Whether you go for measurement charts, tables, graphs, or any other type, you should already know when to use such measurement systems in the first place. In fact, there are many applications on when you can find the measurement charts to be relevant. And some of the examples or common uses of such charts are the following:
What Are the Basic Parts of a Measurement Chart?
Now that you are fully aware of a measurement chart’s definition, importance, and functions, how about what a measurement chart looks like? Indeed, measurement charts are different from one example to another. But there are common elements as well which you should expect in a standard measurement chart. And the standard parts of these charts are:
Title or Purpose
There should be a clear title of your document that has the words ‘measurement chart.’ That way, everyone who sees the chart will understand what it basically is. You can be more specific about the title by inserting your purpose like a BMI chart, clothing measurement chart, and any other example. You may also see Reward Chart
Unit of Measurement
Measurement charts should specify the units of measurement. You could either focus on measuring by length, weight, temperature, or maybe speed. And it isn’t right to just have all units of measurement under one table because it would confuse audiences. Divide them accordingly so people would know which set is specifically for length measurements, weight measurements, and the like.
Tabular Charts
It is common that measurement charts are prepared in tabular form. Tables are the graphical representation of measurement data where there are columns and rows to indicate specific measurements. But you can also be more creative by adding graphs and other visual organizers to present the chart. Others even use color-coding or legends to show what figures mean in a document. You may also see Waterfall Chart
Labels
Labeling the chart is also crucial. Otherwise, it would be hard for people to understand what the numbers mean inside the measurement charts. Let’s say you use a length measurement chart. You still have to be more specific by labeling if the digits are in inches, decimals, or millimeters. With weight, it could be metric or imperial. Meanwhile, the temperature can either be Fahrenheit or Celsius. And for speed, you could measure via mph or km/h. You may also see Corporate Organizational Chart
How to Make a Measurement Chart
Measurement charts can help you anytime, particularly when there are endless things to measure out there. But, what matters the most is that you have prepared correct and well-made measurement charts. Thankfully, the process isn’t that difficult to make. In making the best measurement chart, you only need to observe the steps:
Step 1: Identify Your Purpose
First things first, what is your purpose in making the measurement chart? Is it for measuring clothes of your next dress shop, for teaching measurements in school, or maybe for measuring food products? Whatever your purpose is, align your measurement chart according to your desired function. Otherwise, it would be irrelevant to have units of measurement that are meant for sewing clothes for a purpose of cooking measurements. You may also see Pareto Chart
Step 2: Use a Sample Measurement Chart
Now that you are sure of your purpose, kindly check your preferred template from the sample measurement charts listed on top of this article. Be sure your chosen sample fits well with your desired purpose. In fact, you can always edit, print, and download sample measurement charts. Hence, there is no need to stick with standard examples because you can personalize the chart. Also, these samples are premade so you only need to work on the finishing details rather than working right from the start. You may also see Reflexology Chart
Step 3: Indicate Instructions on How to Use the Chart
While a measurement chart sure is helpful, the problem could be it is hard to follow. Thus, find ways to make it user-friendly. Start with adding instructions to the chart so people would know how to read it and how to use it for actual applications. It is crucial that you label the units of measurement precisely because the numbers indicated for meters will not be the same in kilometers. Also, you can add more categories and visual organizers for a more pleasant experience in using the chart. You may also see Tracking Chart
Step 4: Research on Accurate Measurements for Comparisons
It is expected that you write down a list of measurements from zero down to the maximum number that fits your measurement. But, have you considered an assessment if they are actually correct? Always take time in researching for the actual numbers in meters, inches, centimeters, or any other unit. That way, you can double-check if what you listed is precise enough or still needs to be fixed. You may also see Blood Sugar Chart
Step 5: Complete the Measurement Chart’s Parts
Your chart would not be complete without its essential parts. You already know about the basic parts of a measurement chart right from the title down to the labels anyway. Therefore, you must add them individually to complete your chart. Lastly, finalize how you want your chart’s output should be. Besides being printed or sent as a soft copy, others want to make use of charts with cardboard or any other format. Settle its last presentation until you are ready to present it. You may also see Complex Organizational Chart
What are the basic units of measurement?
It is known that there are seven basic units of measurements. These are the length in meter, time in second, amount of substance in mole, electric currents in ampere, luminous intensity in candela, temperature in kelvin, and mass in kilogram. You may also see Non-Profit Organizational Chart
What are the types of measurement scales?
Measurement scales are divided into four types. These are the ordinal, nominal, interval, and ratio. You may also see Bar Chart
What is a metric conversion chart?
Metric conversion charts refer to the whole list of metric units like weight, length, and etc. And they are listed adjacent to their corresponding converted measurements. And this chart is useful so you won’t have to convert measurements with calculators or any other tool. You may also see Flow Chart
What Are the 5 Major Types of Measurements?
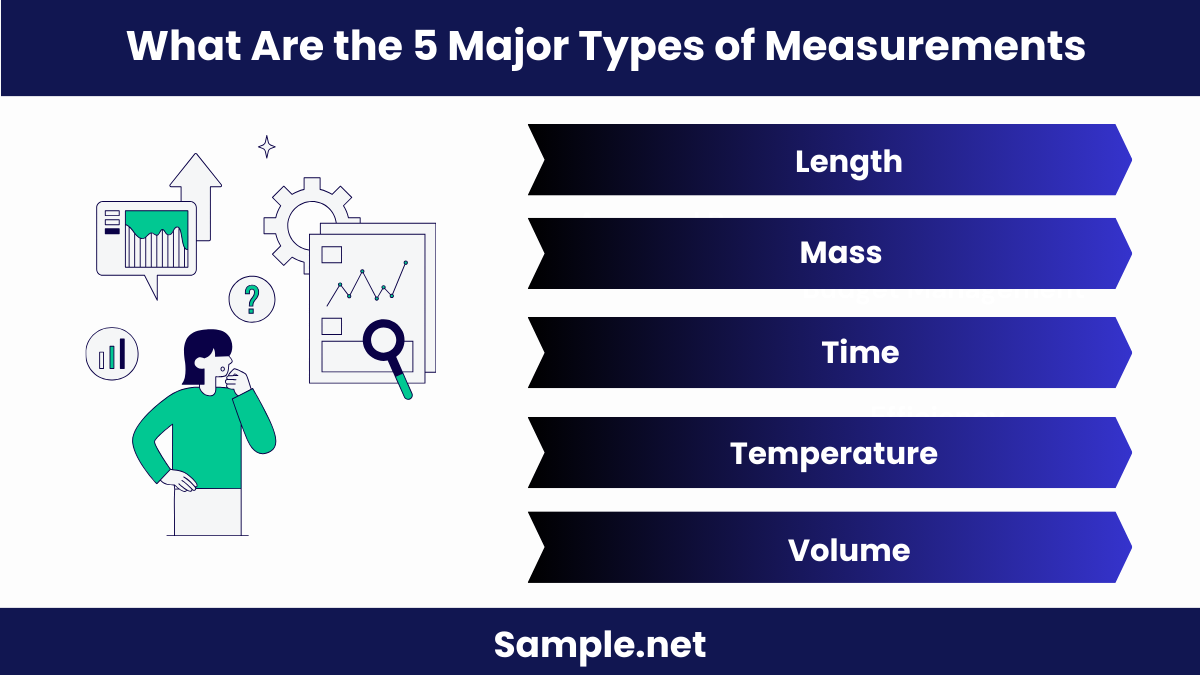
Understanding the major types of measurements is crucial for different fields and applications.
- Length: Measurement of distance or height.
- Mass: Measurement of weight or quantity.
- Time: Measurement of duration or intervals.
- Temperature: Measurement of heat intensity.
- Volume: Measurement of space or capacity, similar to data in a Unit Circle Charts & Diagram.
What Are the 10 Basic Units of Measurement?
The 10 basic units of measurement are foundational for understanding and utilizing measurements effectively.
- Length: Meter (m)
- Mass: Kilogram (kg)
- Time: Second (s)
- Electric Current: Ampere (A)
- Temperature: Kelvin (K)
- Luminous Intensity: Candela (cd)
- Amount of Substance: Mole (mol)
- Area: Square meter (m²)
- Volume: Cubic meter (m³)
- Pressure: Pascal (Pa). You may also see Circular Organizational Chart
What Is a Measuring Chart?
A Measuring Chart is a visual tool used to record, compare, and analyze different measurements.
- Purpose: Explain the use of the chart in recording and comparing measurements.
- Types: Describe various types of charts, such as Bubble Chart and Baby Weight Chart.
- Creation: Steps to create a measuring chart.
- Usage: How to effectively use the chart for analysis.
- Benefits: Highlight the advantages of using measuring charts in different fields.
How Do I Read Measurements?
Reading measurements involves understanding the units and interpreting the data accurately.
- Identify the Unit: Know the unit of measurement being used.
- Read the Scale: Look at the scale or markings on the measuring tool.
- Record the Measurement: Write down the measurement accurately.
- Convert if Necessary: Convert the measurement to other units if needed.
- Verify Accuracy: Double-check the measurement for accuracy, similar to Tap and Drill Chart usage.
What Are the Four Basic Measurements?
The four basic measurements are essential for various applications in daily life and professional settings.
- Length: Measurement of distance.
- Mass: Measurement of weight.
- Time: Measurement of duration.
- Temperature: Measurement of heat or cold, akin to readings in an Project Management Workflow Chart.
What Are the 7 Metric Measurements?
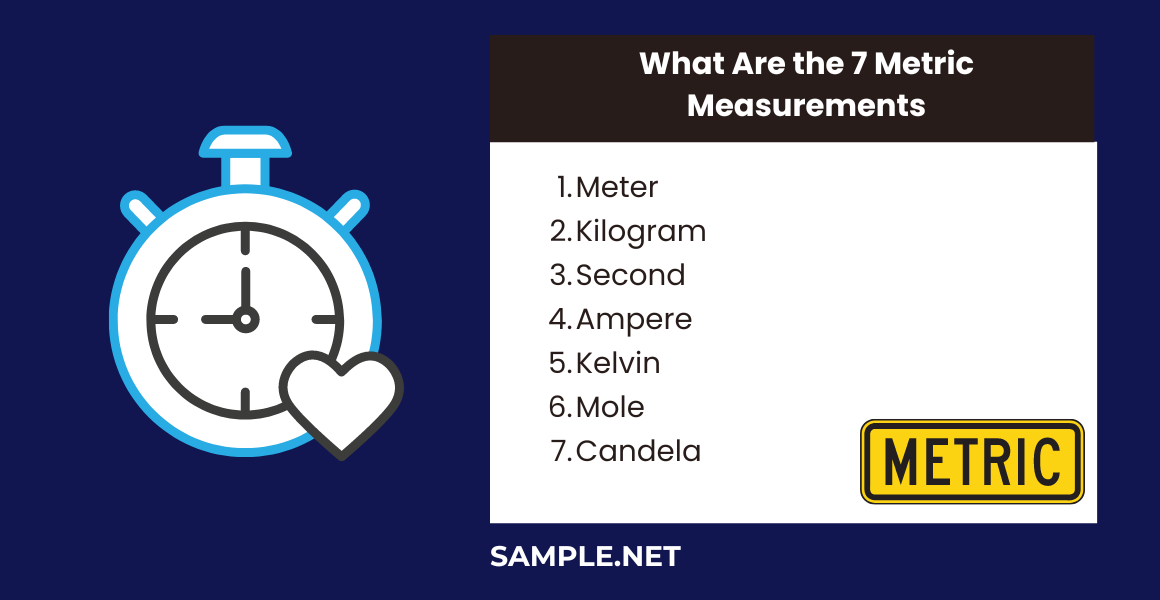
The seven metric measurements form the basis of the metric system, widely used globally.
- Meter (m): Unit of length.
- Kilogram (kg): Unit of mass.
- Second (s): Unit of time.
- Ampere (A): Unit of electric current.
- Kelvin (K): Unit of temperature.
- Mole (mol): Unit of substance.
- Candela (cd): Unit of luminous intensity, used in Behavior Chart for clarity in visual data representation.
How Should You List Measurements?
List measurements in a logical order, starting with the largest unit and proceeding to the smallest, similar to structuring a Team Charter.
How Do I Read Measurements?
Read measurements by identifying the unit, reading the scale, and recording the value accurately, much like interpreting data on an Exercise Chart.
What Are All the Measurement Symbols?
Measurement symbols include m (meter), kg (kilogram), s (second), A (ampere), K (kelvin), mol (mole), and cd (candela), similar to symbols in a Project Flow Chart.
What Is the Easiest Way to Measure?
The easiest way to measure is using a ruler or measuring tape for length, ensuring accuracy like using a Seating Chart for arrangements.
What Is the Unit of Measurement for Length?
The unit of measurement for length is the meter (m), which is the standard unit in the metric system, similar to units used in a Gantt Chart Research Proposal.
What Is the Smallest Unit of Length?
The smallest unit of length is the millimeter (mm), which is commonly used for precise measurements, akin to detailed segments in a Pie Chart.
What Is the Basic Unit for Measuring Distance?
The basic unit for measuring distance is the meter (m), widely used in science and everyday applications, similar to how a Business Organization Chart uses a basic structure to represent hierarchy.
In conclusion, mastering the creation of a Measurement Chart is essential for accurate data representation and analysis. With our guide, you have learned how to draft detailed samples, forms, and letters, ensuring your charts are well-documented and impactful. Utilizing the provided templates and tips, you can streamline your chart-making process and enhance the effectiveness of your data presentations. For more detailed examples and templates, visit Goal Chart.