9+ Sample Pick Charts
-
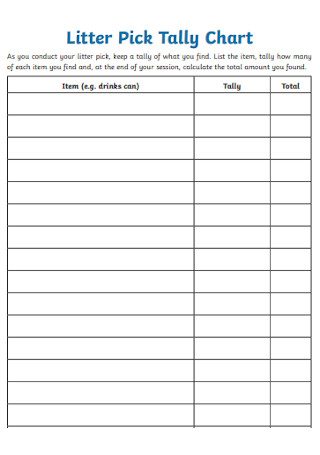
Litter Pick Tally Chart
download now -
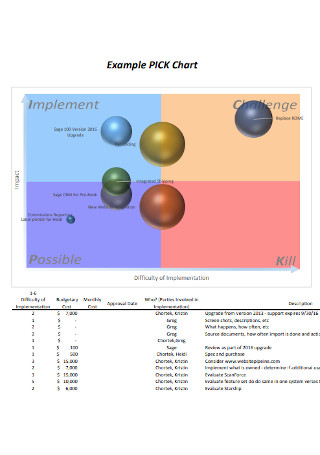
Simple Pick Chart Example
download now -
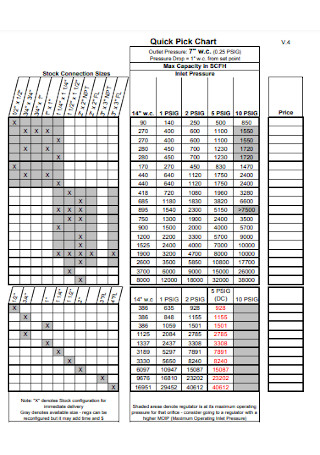
Quick Pick Chart
download now -
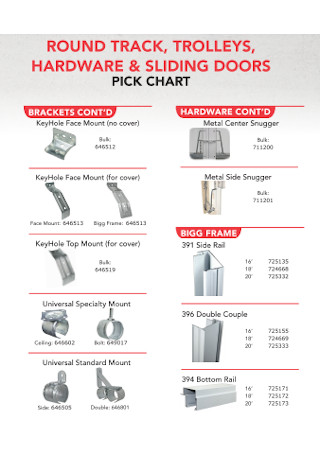
Sliding Doors Pick Chart
download now -
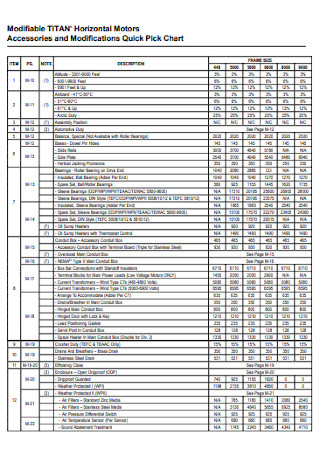
Modifications Quick Pick Chart
download now -
Standard Pick Chart
download now -
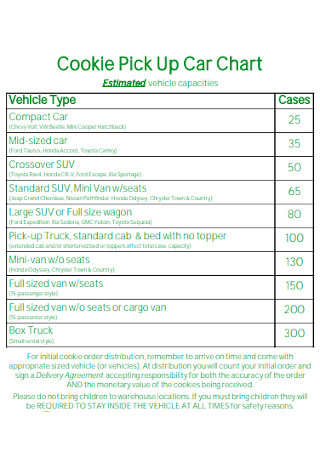
Cookie Pick Up Car Chart
download now -
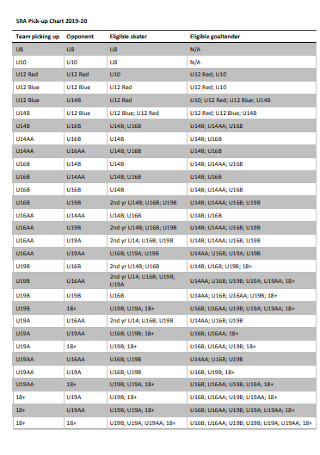
Pick-up Chart Format
download now -
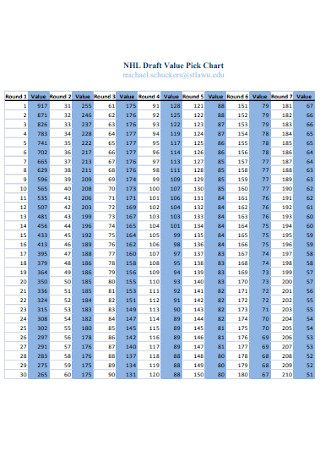
Value Pick Chart
download now
What is a PICK Chart?
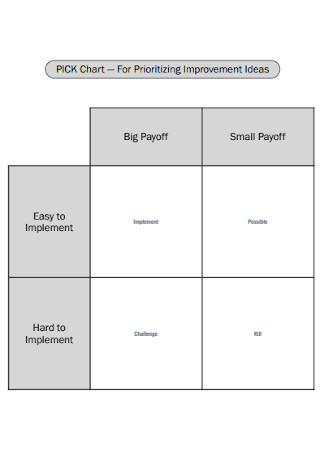
The PICK Chart, also called an Ease Impact Matrix or Impact Effort Matrix is a Lean Six Sigma (LSS) management method that measures the process performance of ideas, projects, goals, or a job for its improvement. The PICK Chart is a visual tool plotted on a 2X2 Matrix that is divided into four quadrants that distinguish ideas based on payoff and difficulty level. PICK is an acronym for Possible, Implement, Challenge, and Kill. It allows you to categorize your ideas and tasks into four progress-gauging categories based on a rough estimate of its return on investment (ROI); which is a metric that determines whether an investment will pay off with the rewards you were expecting. It is utilized by businesses as a Project Planning tool to execute the best possible plans by determining the rough result they will get from an idea by organizing tasks according to their importance to make their business process more efficient.
Benefits of Using a PICK Chart
A PICK chart allows people to come together to brainstorm the factors that they want to change in their work process to attain better and improved results. It helps them decide how to gain insight on how an individual or a company can plan for better decisions for better workload execution. This helps companies set their priorities straight and drive better business results. It gives awareness on how difficult a certain task would be, and what it would require you to execute it. PICK Chart estimates a project’s resulting work process’ ease of impact on its implementation. Essentially, it makes you ask the question: is it worth it?
Time Management
It promotes better Time Management as it helps you set a path to accomplish your goals according to their importance or impact. your *work process that leads to efficient results, making you a better employee, professional, or just a regular individual with Goals.
Effectivity
It is effective as you can get an estimate as to how an investment will turn out; did you choose the best idea or project to progress workload efficiency? Once you organize tasks according to measurements of priority or importance, you are better able to implement the changes after seeing effective results.
More Business Success
Utilizing a PICK chart will give you a faster turnaround time for your projects as it increases the work process efficiency. It gives you a depiction of your goals’ potential benefits so that you may have a clearer view of which task to choose. Which idea in a sea of task checklists should you prioritize for execution? Project planning with the PICK chart identifies the root causes of a system’s problems by identifying which tasks to kill off.
How To Utilize a PICK Chart and its Parts
If you want the best business tools for planning your workloads and projects, the PICK Chart helps you figure out which path to take that leads to business success. The four quadrants of a PICK Chart each represent an organizational gauge or measurement to help you determine the best possible idea, project, or decision for Business Development. Each quadrant is separated according to high to low payoff or reward. You can easily plot your own PICK Chart by utilizing a whiteboard and plotting your Ideas on post-it notes or by using a flip chart. Let’s get a better understanding of each quadrant for utilizing our PICK Chart templates.
1. Identify and score your project goals and ideas
First, you can start by defining your scale to get a clear picture of how you want to measure your PICK Chart goals. Assign an Ease & Impact score for each one based on their payoff and assign them to a quadrant on the matrix. You can score a task by asking yourself what its reward will be after you complete it. Did it bring you closer to your goals? Or is it just a roadblock or a distraction? Scoring ideas according to their return of investment helps gain maximum work efficiency. Because who wants to waste their time on a potentially bad investment that would result in a loss of resources?
2. Ease and Impact Scale or Axis
This is essentially your PICK Chart’s scoring system; the x and y axis. Label one axis Ease, for the level of difficulty of a job. And the other axis Impact or Reward, pertaining to the significance of the impact. Number each x and y axis to reflect your ideal progress measurement. On the Ease scale, 1, being the lowest, can be assigned as very difficult to implement due to how long it would take to implement them or having no proper support. 5 is very easy to implement; which means tasked that can be accomplished easily or possibly delegated to someone else. It can also be said that the highest level of Ease measurement means that there are little to no barriers that prevent you from achieving the tasks. Plotting the Impact scale holds the same rules–making 1 the least for zero-impact activities–denoting a high risk for wasting time, effort and resources. And 5 being the highest can ascribe causing significant impact across wide ranges; giving you significant benefits.
3. Possible Quadrant:
The POSSIBLE quadrant, located at the lower left part of our 4-part flowchart* depicts tasks measuring low payoff yet easy to accomplish tasks. Here you can list tasks that will help you gain momentum in your Task Completion as tasks here can get done right away. An example for this would be the chores dictated in our checklists as we work on more pressing matters such as our paying job, which is an Implement task of high reward; your professional standing and salary, with a high level of difficulty as it requires a lot of effort. These tasks are also what we can delegate to other people if their jobs require it so; or jobs you can accomplish after commiting to your heavier Implement tasks.
4. Implement Quadrant:
If you are a busy body or a person who wants to get tasks done efficiently, focus on the IMPLEMENT quadrant on the upper left part. This depicts tasks that are of high importance due to high payoff and satisfaction. Basically, these are the tasks that you should greenlit due to their urgency regarding your individual or business plans. For example, pressing medical matters that can’t be put off until tomorrow, attending a meeting, or getting to a project or an errand that has a tight deadline.
5. Challenge Quadrant:
Have you ever wanted to take that vacation to that white sand beach where you roam at the back of your mind–but not until you accomplish your commitments at work. CHALLENGE, the quadrant beside Implement refers to your long-term goals. It’s what you accomplish right after its high payoff, high reward neighbor. Let’s just say that these are the rewards that lead to accomplishing your Implement tasks. Task building is difficult to do, but with division into 4 sections make it less complicated. Go reach for your Challenge-ing goals, despite them being hard to do. to ensure the benefits ARE WORTH THE EFFORT
6. Kill Quadrant:
True to its name, this is where you might want to put tasks that are unrewarding and would give you little to no benefit on your goal plans. After plotting them, you can also do Task Analysis to review if you can place them in the other three quadrants instead. If not, you might want to ignore them completely. Low payoff, difficult to do. These are the tasks that will set you on another path away from your goals. If you want to accomplish such as mindlessly scrolling on social media or bingeing on junk food when.
FAQs
What is process improvement?
Process improvement runs on the principle of comparison. It is the practice of enhancing the quality of a process to achieve business goals. It is analyzing how we can do our work better. It is a methodology used to combat redundancies in processes that lead to project delays, employee demoralizing, and productivity decline to increase operational efficiency. Process improvement identifies process parts and the functional aspects that could be reevaluated to enhance process quality. It analyzes a process and identifies its loopholes as to reduce wasted resources. Once the loopholes are properly addressed and tackled, they can be further integrated to a goal plan.
Aside from the tips mentioned above, it is also important to get outside perspective from those around you. Get outer advice from people who will be affected by the ideas or content of your PICK Chart, ensuring objective output. It benefits you by helping you see outer perspectives, and which projects may have extra benefits you haven’t considered.
What are other ways to plot your PICK scores?
Project planning is the process of calculation wherein several ideas are compared for important projects to get a rough figure of which would produce the greatest profit and benefit. This calculation may also be utilized in all aspects of life–to analyze the investments we can get the greatest reward in.
What is project planning?
Lean Six Sigma is a methodology based on a combination of two of the most popular schools of thought—Lean and Six Sigma—a business tool to achieve effective processes with the aim to improve and create more effective processes
According to leansixsigmadefinition, Six Sigma is a disciplined, statistical-based, data-driven approach and continuous improvement methodology for eliminating defects in a product, process or service. It was developed … based on quality management fundamentals, then became a popular management approach.
What is lean six sigma?
We’ve all been through a lack of project planning when it came to our work responsibilities. When handling multiple projects, the simple task of task planning and prioritizing workloads according to priority makes it less overwhelming. When we have the chance to apply tools in our work projects, we start seeing Process Improvement.