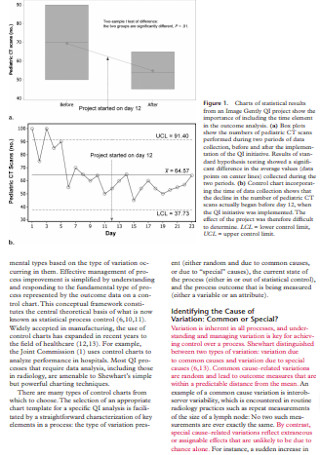
19+ Sample Control Charts
-
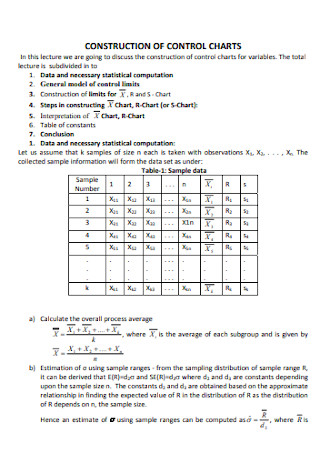
Construction of Control Chart
download now -
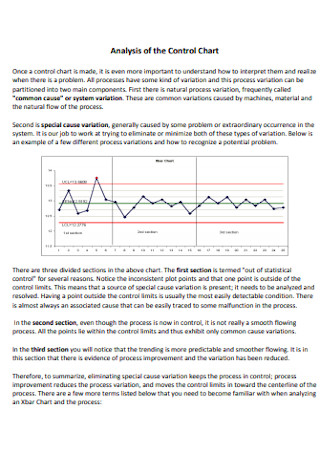
Analysis of the Control Chart
download now -
Sample Control Chart Template
download now -
Basic Control Chart
download now -
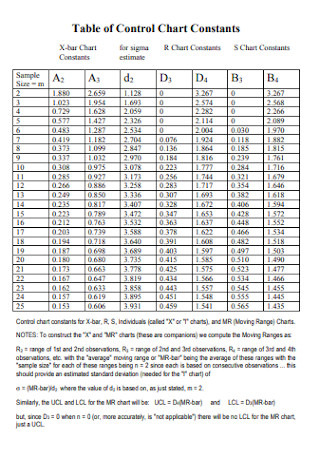
Table of Control Chart Constants
download now -
Control Chart in Healthcare
download now -
Cost of Control Pie Chart
download now -
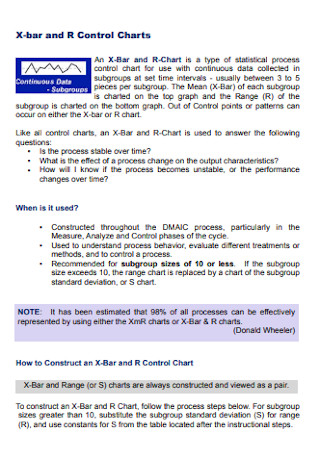
X-bar and R Control Charts
download now -
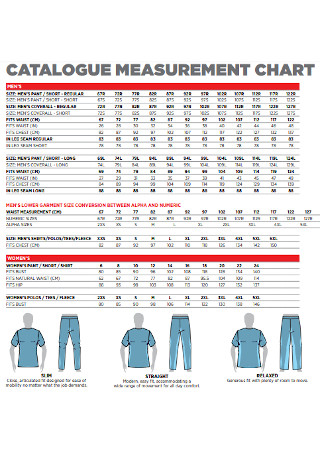
Catalogue Measurement Control Chart
download now -
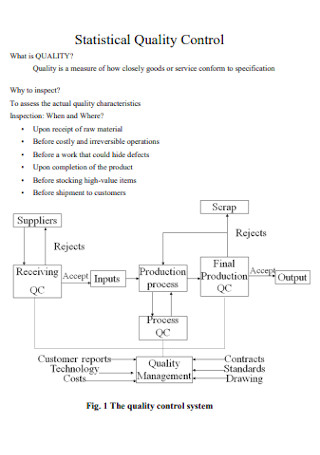
Statistical Quality Control Chart
download now -
Control Chart Format
download now - “]
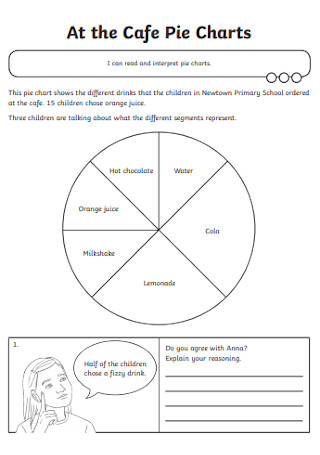
Café Control Chart
download now -
Simple Control Chart
download now -
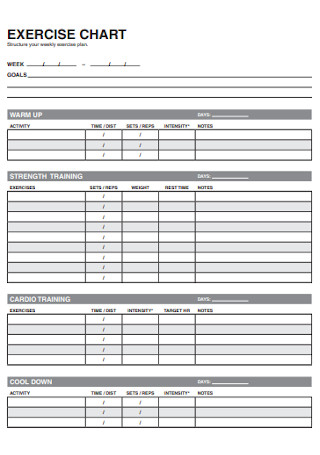
Exercise Control Chart
download now -
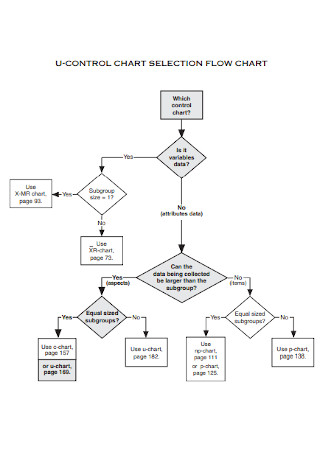
Control Chart Seclection Flow Chart
download now -
Diagnostic Control Chart
download now -
Statistical Control Chart Example
download now -
Hospital Measuring Control Chart
download now -
Run Chart and Control Chart
download now
FREE Control Chart s to Download
19+ Sample Control Charts
What Is a Control Chart?
Elements of a Control Chart
Advantages of Using a Control Chart
Types of Process Variations
Types of Control Charts
How To Implement and Use Control Charts
FAQs
What are the types of quantitative data?
What are the types of errors in a control chart?
Are there downsides to using control charts?
What Is a Control Chart?
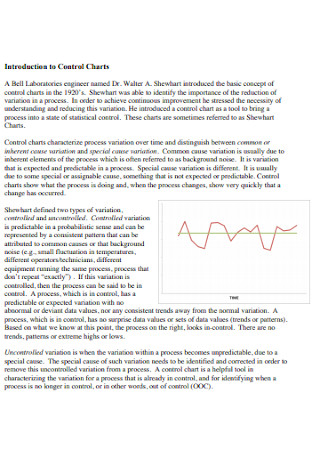
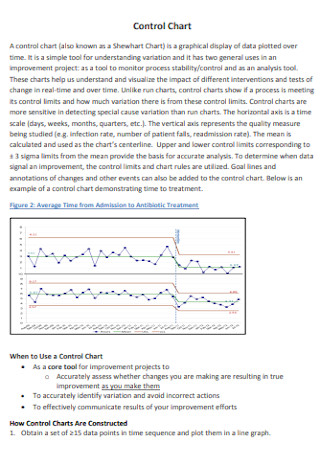
Control charts, invented by Dr. Walter Shewhart, are a statistical process control tool used to determine whether a manufacturing or business process is under control. When the underlying form of the process distributions is known, traditional control charts are mostly designed to monitor process parameters. In the twenty-first century, however, more advanced techniques are available that allow incoming data streaming to be monitored even without knowledge of the underlying process distributions. In other terms, they are routinely used to monitor the quality of a process.
Elements of a Control Chart
Here are the main elements of a control chart:
- A visual time-series graph that depicts data points collected at regular intervals.
- A horizontal control line that can help you see variations and trends more easily.
- Horizontal lines placed at equal distances above and below the control line to represent upper and lower control limits. These upper and lower limits are derived from the data recorded on the time series graph over a specified time period.
Advantages of Using a Control Chart
In addition to providing actionable information for correcting issues as they happen in real-time, here are some of the other advantages that a control chart can provide:
Types of Process Variations
Understanding the types of process variations is critical to monitoring the stability of a process. It is also critical before even making a control chart. Here are the types of process variations:
- Common Cause Variations – Common Cause Variations are predictable and always present in your processes. Consider how long it takes you to get to work every morning as an example. Even if you take the same route every morning, the journey is never the same. Maybe it takes you 20 minutes from the time you leave your house to the time you pull into the parking lot. Because of common cause variations, such as stoplights and traffic congestion, it will take less time on some days and more time on others. When variations remain within your upper and lower limits, there is no immediate need to change your process because everything is operating within predictable parameters.
- Special Cause Variations – Special Cause Variations are typically sporadic and unpredictable. Running out of gas, engine failure, or a flat tire, for example, could cause your commute to be delayed by an hour or more, but these types of unforeseen events are unlikely to occur on a daily basis. When unusual cause variations occur, it’s still a good idea to investigate what went wrong and see if these anomalies can be avoided in the future. In our commuting example, you could ensure that you stop at a gas station when you run out of gas and that your vehicle is well maintained to ensure proper operation.
Types of Control Charts
Here are some of the various types of control charts:
- x? and s Chart – It is a type of control chart that is used to monitor variables data when samples from a business or industrial process are collected at regular intervals. This relates to traditional statistical quality control (SQC) and statistical process control (SPC). The “chart” is actually two charts: one for monitoring the process standard deviation and another for monitoring the process mean. The x? chart is only valid if the variability within the sample is constant. Thus, the s chart is examined before the x? chart; if the s chart indicates that the sample variability is under statistical control, the x? chart is examined to see if the sample mean is under statistical control as well. If, on the other hand, the sample variability is not under statistical control, then the entire process is deemed to be under statistical control regardless of what the x? chart shows.
- Individual/moving-range chart – Individual/moving-range charts are a type of control chart used to monitor variable data from a business or industrial process where rational subgroups are impractical. When automation allows inspection of each unit, the chart is required, so rational subgrouping has less benefit. It is also used when production is slow enough that waiting for enough samples to form a rational subgroup causes unacceptable delays in monitoring, as well as for processes that produce homogeneous batches (e.g., chemical) where repeat measurements vary primarily due to measurement error.
- p-chart – The p-chart is a type of control chart used to monitor the proportion of nonconforming units in a sample, where the nonconforming sample proportion is defined as the ratio of the number of nonconforming units to the sample size (n). The p-chart only supports “pass”/”fail” inspections determined by one or more go-no-go gauges or tests, effectively applying the specifications to the data before plotting it on the chart. Other types of control charts display the magnitude of the quality characteristic under investigation, allowing direct troubleshooting from those charts.
- EWMA Chart – The EWMA chart (also known as Exponentially Weighted Moving Average chart) is a type of control chart that is used to monitor either variables or attributes-type data over the entire history of output from the monitored business or industrial process. Unlike other control charts, which treat rational subgroups of samples separately, the EWMA chart tracks the exponentially weighted moving average of all prior sample means. EWMA weights samples in descending geometric order, so that the most recent samples are weighted the most heavily, while the most distant samples contribute very little.
- c-chart – The c-chart is a type of control chart that is used to track “count-type” data, such as the total number of nonconformities per unit. It is also sometimes used to track the total number of events that occur in a given unit of time. The c-chart differs from the p-chart in that it allows for multiple nonconformities per inspection unit and requires a fixed sample size. The p-chart only models “pass”/”fail” inspection, whereas the c-chart and u-chart can distinguish between, for example, two items that fail inspection due to one fault each and the same two items that fail inspection due to five faults each; in the former case, the p-chart will show two non-conformant items, while the c-chart will show ten faults.
How To Implement and Use Control Charts
Here are the steps needed to effectively implement and use control charts:
-
1. Select a Measurement Method and Verify It
Control charts allow for the Analysis Of Data and trends over time, so decide what data you will collect first. In control charts, two types of data are used: variable and attribute data. Variable data is the result of continuous-scale measurements. It includes elements such as time, weight, temperature, and size. Keep in mind that variable data should also be unbiased. On the other hand, attribute data includes arbitrary distinctions such as pass/fail and good/bad.
After selecting the measurement system, verify it. One important step that companies often overlook is validating that the data being input into the control chart is accurate. If you input bad data, you’ll make flawed decisions and potentially make processes worse. It is smart to conduct periodic spot checks on your measurement system.
-
2. Begin Data Collection and Determine Where it Will be Stored
Create a strategy for gathering data on a regular basis. The people who will collect the data should be trained properly in how to measure and chart the results. The best approach someone can use for storing the collected data is to use an improvement platform with control chart capabilities. This allows all stakeholders to have access to the information and create a history of the process results over time.
-
3. Document the Reaction Plan
When you have your control chart and some data, the next step is to have a defined reaction plan that outlines what will happen if a process becomes out of control or nearly out of control. In this process, flow charts and other types of decision trees can prove to be useful tools.
-
4. Calculate Limits and Assess the Process
Once you’ve begun collecting data, you can compute the upper and lower control limits, which are typically three standard deviations from the mean. After that, determine whether or not the process is out of control. When an out-of-control condition occurs, it is most likely the result of a special cause variation that is caused by another process or event. The next goal is to determine the underlying Cause Of The Variation. A common cause variation occurs when the chart is in control. There are typically many contributors to common cause variation such as the various factors that are present in the system on a daily basis. When we have common cause variation, we can improve the system, but it is usually a less reactive process where asking “what went wrong last period?” is a less useful question.
-
5. Implement Actions to Improve the Process
Once the true cause of the variation is identified, corrective action can then be taken to resolve the problem and improve the process so that it does not happen again. It is not a complicated process overall, but proper care must be observed so that the implementation is effective.
FAQs
What are the types of quantitative data?
The two types of quantitative data are discrete and continuous. Discrete data refers to quantitative data that can only have specific numerical values. These values are fixed and cannot be subdivided. Tally charts, bar charts, and pie charts are commonly used to represent it. Continuous data, on the other hand, refers to quantitative data that can be infinitely divided into smaller parts. This type of quantitative data can be represented on a scale, such as the length of a piece of string in centimeters or the temperature in degrees Celsius. Continuous data, in essence, can take any value; it is not restricted to fixed values.
What are the types of errors in a control chart?
There are two types of errors in a control chart. Type I or Alpha errors occur whenever a point falls outside the control limits despite the absence of a special cause. As a result, there is a hunt for special causes, and things are frequently tweaked. Tampering typically distorts a stable process while also wasting time and energy. Type II or Beta errors occur when you miss a special cause because the chart isn’t sensitive enough to detect it. In this instance, you will be unaware of the problem and thus unable to solve it.
Are there downsides to using control charts?
Yes, there can also be downsides whenever you use control charts. For instance, control charts can be used incorrectly if the wrong sample group or process parameter/output is selected. If a non-homogeneous sample is used, for example, the results will be skewed. Another oversight can be that incorrect decisions can be made without an understanding of the variation (error) associated with your measurement system.
Control charts are one of the many statistical tools that can be used in aiding continuous process improvement. In addition to that, knowing which type of control chart to use can assure the accurate monitoring of process stability. It eliminates errors and wasted efforts, giving time to genuine opportunities for meaningful improvement. Also, gaining real-time insights into your manufacturing quality control processes through a control chart is important as it can be just the thing to prevent you from incurring unexpected costs that result from process breakdowns and product quality issues. In this article, examples of effective control charts can be obtained for you to use as a reference should you need to make one.