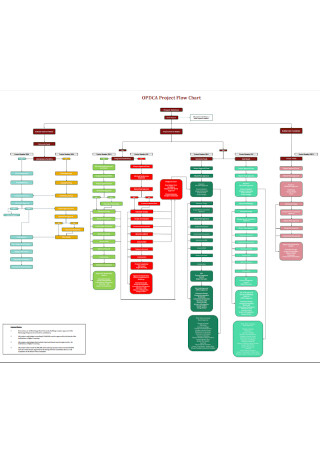
50+ Sample Flow Charts
-
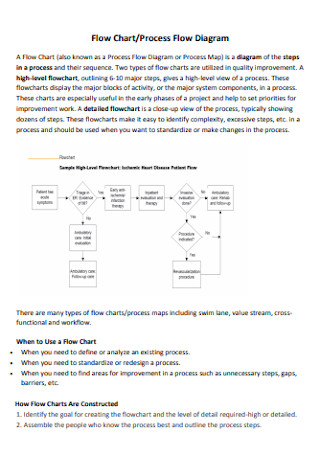
Flow Chart Diagram
download now -
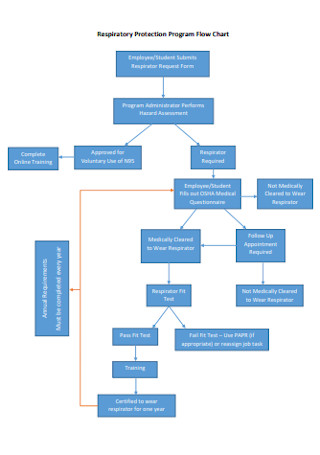
Respiratory Protection Program Flow Chart
download now -
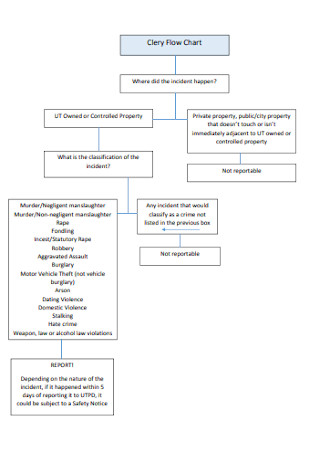
Clery Flow Chart
download now -
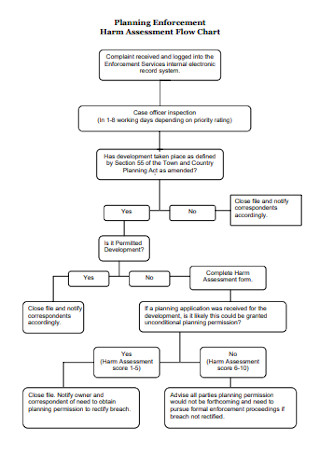
Harm Assessment Flow Chart
download now -
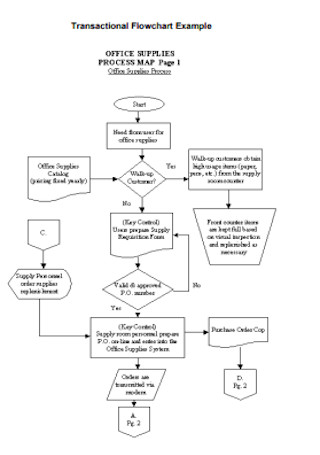
Transactional Flowchart Example
download now -
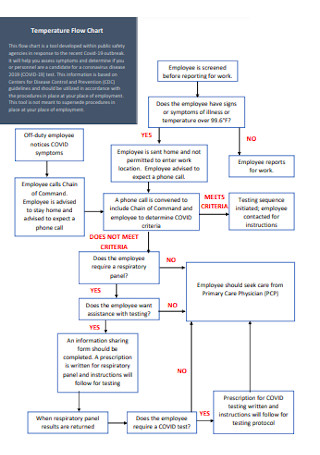
Temperature Flow Chart
download now -
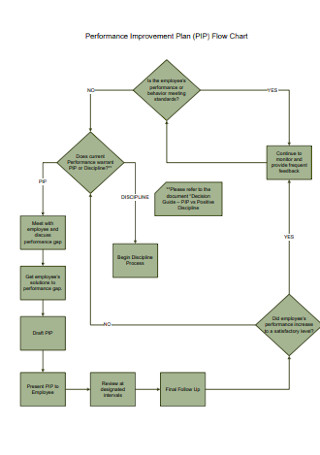
Performance Improvement Plan Flowchart
download now -
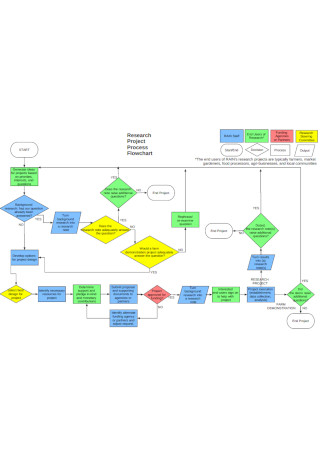
Project Research Flowchart
download now -
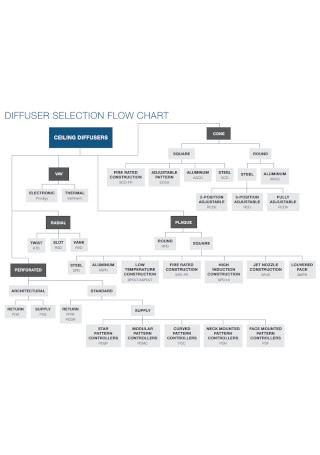
Diffuser Selection Flowchart
download now -
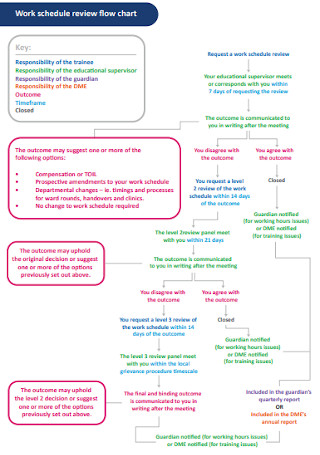
Work Schedule Flowchart
download now -
Sample Flow Chart
download now -
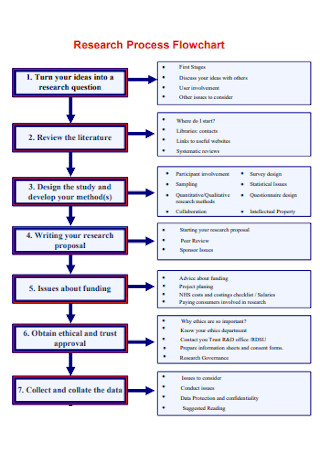
Research Process Flowchart
download now -
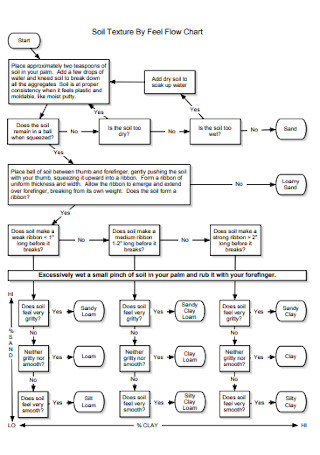
Soil Texture By Feel Flow Chart
download now -
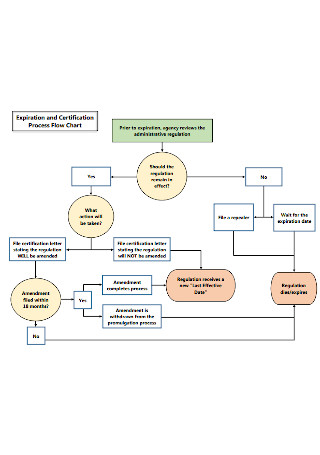
Certification Process Flow Chart
download now -
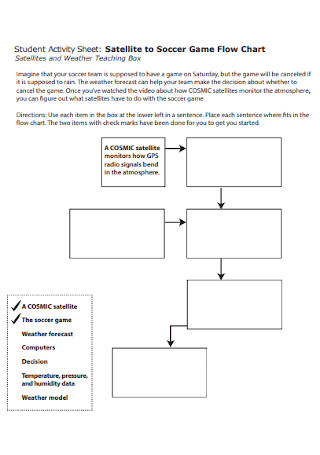
Game Flow Chart Template
download now -
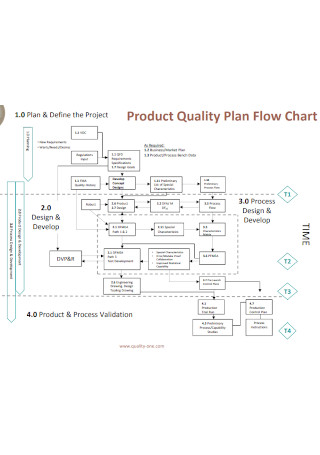
Product Quality Plan Flow Chart
download now -
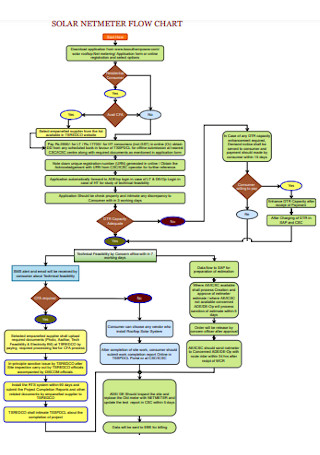
Solar Netmeter Folw Chart
download now -
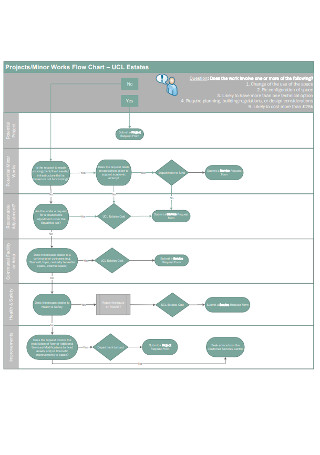
Minor Works Flow Chart
download now -
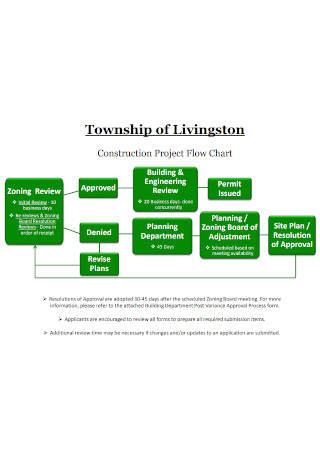
Construction Flow Chart
download now -
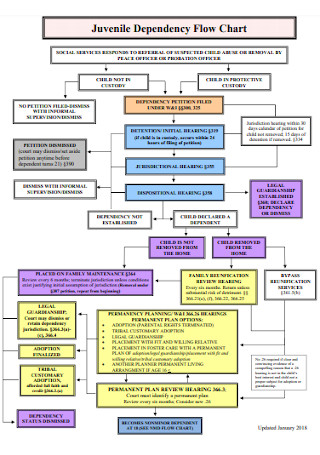
Dependency Flow Chart
download now -
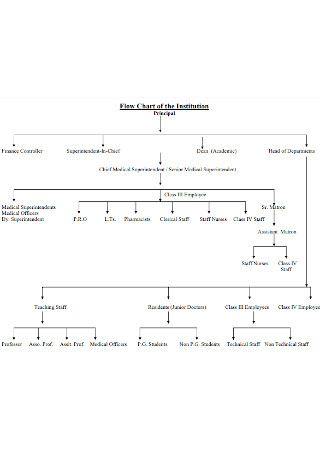
Flow Chart of the Institution
download now -
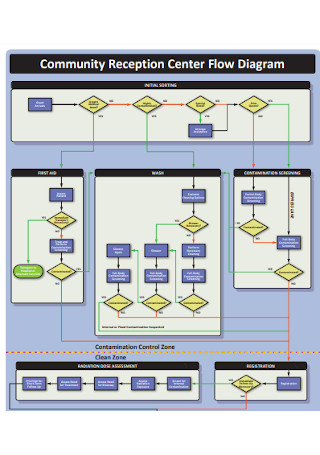
Community Reception Center Flow Chart
download now -
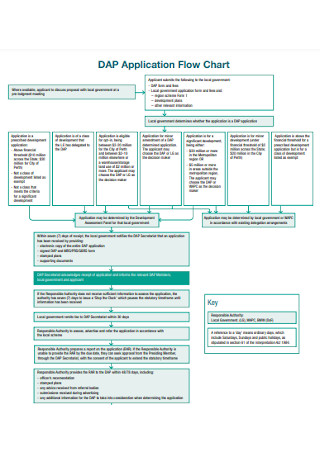
Application Flow Chart
download now -
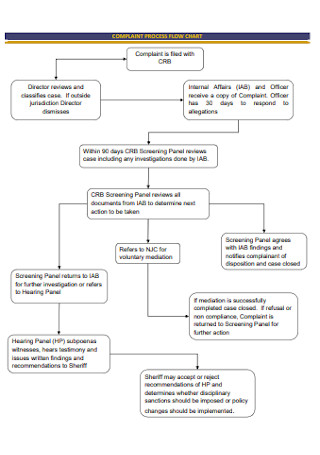
Complaint Process Flow Chart
download now -
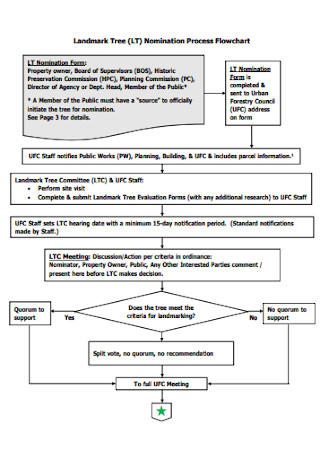
Nomination Process Flowchart
download now -
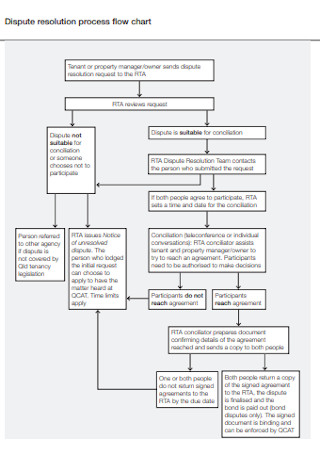
Dispute Resolution Process Flow Chart
download now -
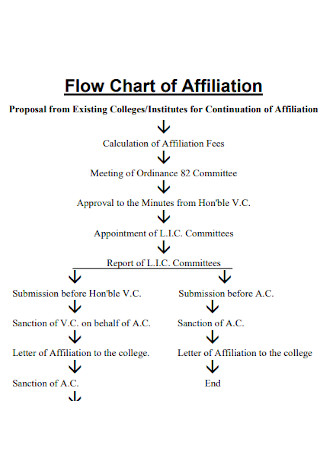
Flow Chart of Affiliation
download now -
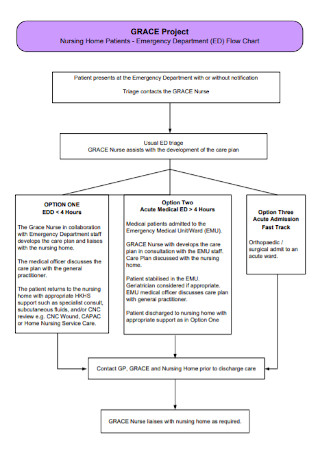
Emergency Department Flow Chart
download now -
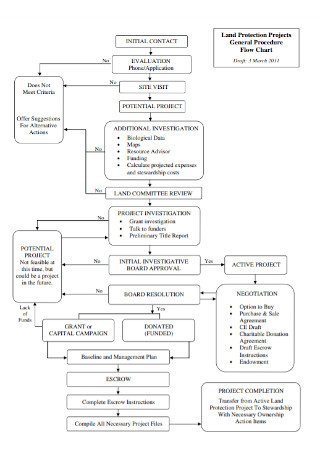
Land Protection Flow Chart
download now -
Sample Program Flow Chart
download now -
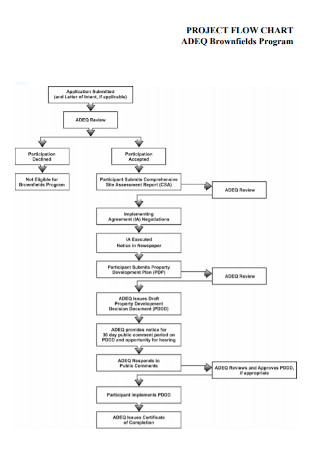
Project Design FLow Chart
download now -
Basic Projecft Flow Chart
download now -
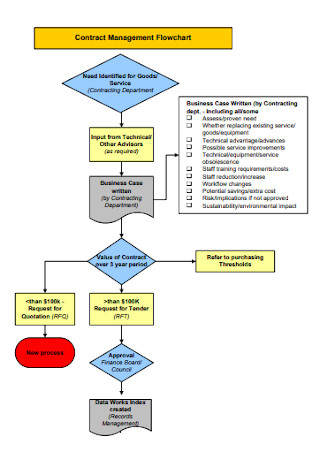
Contract Management Flowchart
download now -
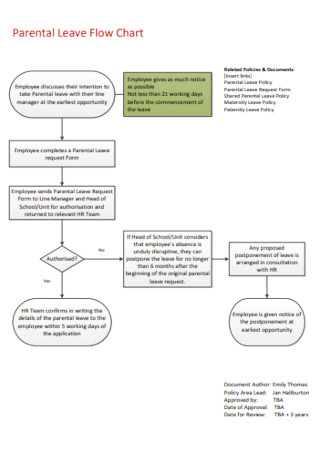
Parental Leave Flow Chart
download now -
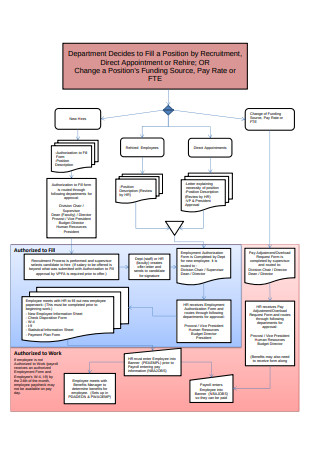
Employee Payroll Flow Chart
download now -
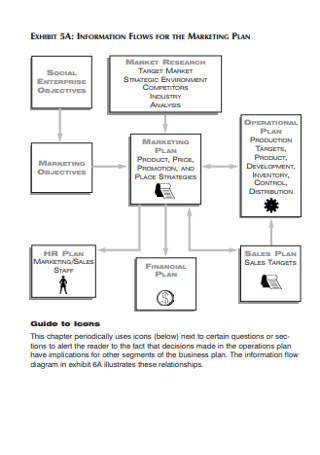
Flow Chart for Marketing Plan
download now -
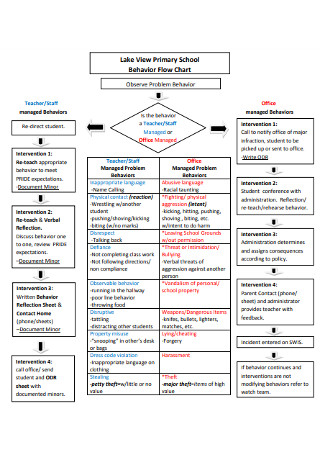
Primary School Flow Chart
download now -
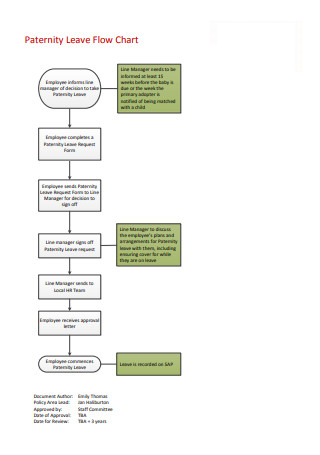
Paternity Leave Flow Chart
download now -
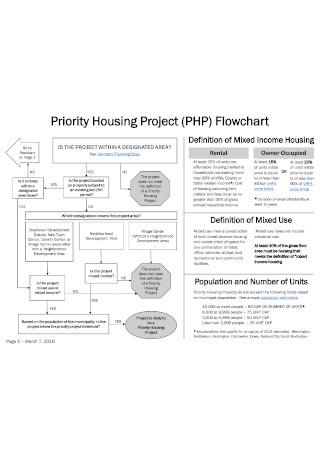
Housing Project Flow Chart
download now -
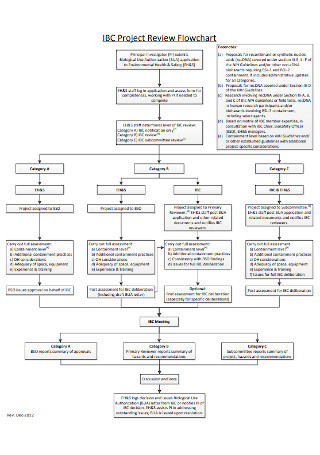
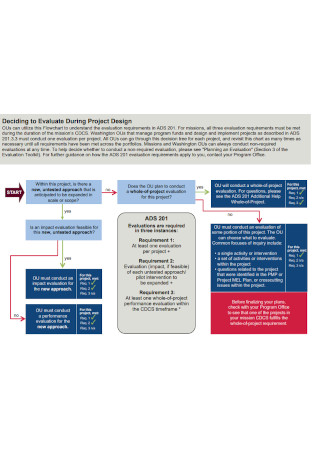
Project Review Flow Chart
download now -
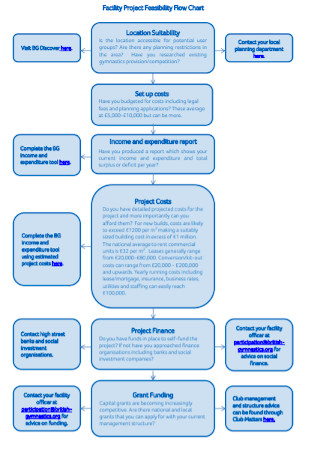
Project Feasibility Flow Chart
download now -
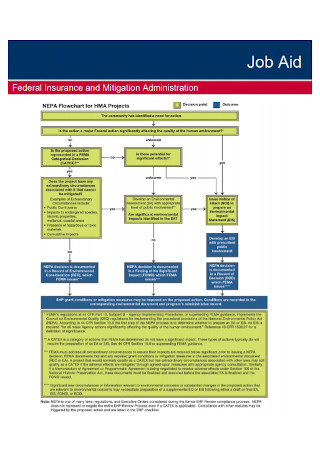
Job Aid Flow Chart
download now -
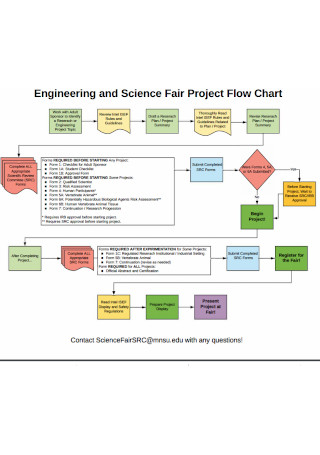
Engineering and Science Flow Chart
download now -
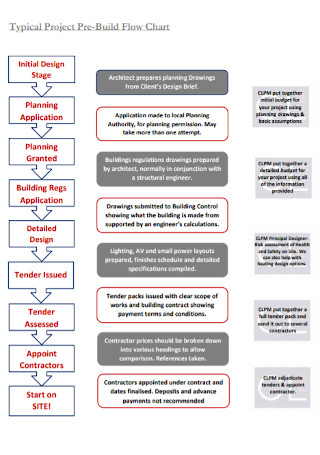
Project Build Flow Chart
download now -
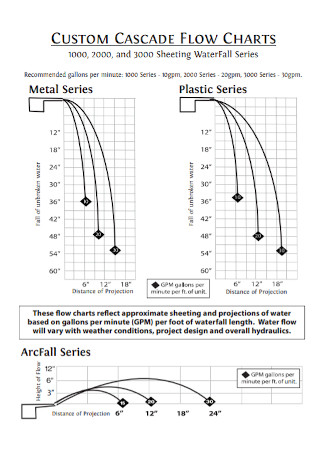
Custom Waterfall Flow Chart
download now -
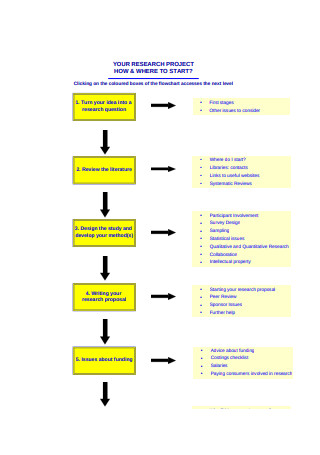
Project Research Flow Chart
download now -
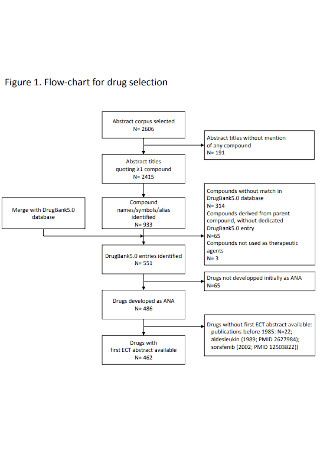
Flow Chart for Drug Selection
download now -
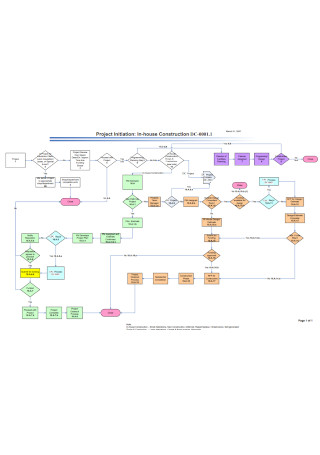
House Construction Flow Chart
download now -
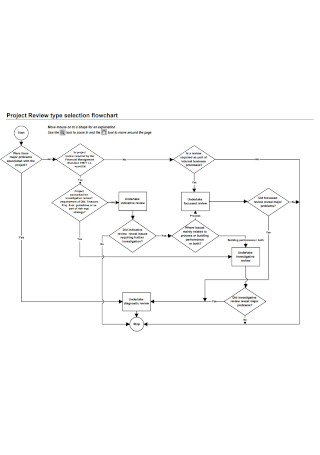
Project Review Flow Chart
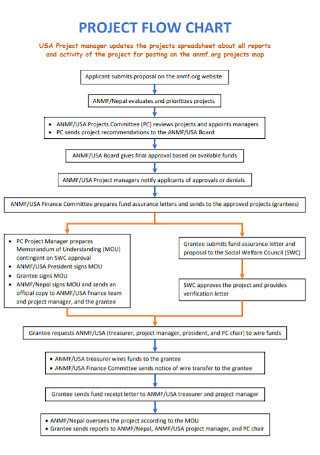
download now -
Standard Project Flow Chart
download now
What Are Flow Charts?
A flow chart is simply a representation of processes and steps using graphical data. And it is a good alternative to explain how a procedure works quickly rather than explaining with long paragraphs and complex technical jargon. Also, you can use flow charts for various functions like constructing business plans, marketing strategies, computer programming, and so much more.
According to Chron, a flow chart’s top three uses are: (1) to define work processes, (2) to assess the tasks’ timing, and (3) to troubleshoot or provide solutions.
Standard Symbols in Flow Charts
A flow chart consists of a diagram and a set of symbols with corresponding meanings. Although the symbols, labels, and signs differ from one function to another, there are common symbols with standard meanings. Learn more about each symbol and what it generally means below.
How to Make a Flow Chart
Before you create a flow chart, have you checked the sample flow charts listed above already? Check them out so you won’t need to make a flow chart right from scratch. Instead, you just design a template, insert details, and produce it shortly. But, don’t forget to follow these steps below to ensure the flow chart you created is done effectively.
Step 1: Brainstorm on the Process or Project to Be Diagrammed
First of all, what is your flow chart for? Identify your main purpose whether it is a project plan, a business production scheme, a web programming strategy, or anything. That way, you can eventually brainstorm for your flow chart’s title and corresponding details.
Step 2: Consider All the Activities and Boundaries Involved
Now that you know your purpose, remember all the activities expected in the process. You can use notes as your reference too so you won’t get wrong. The same goes for recognizing the possible boundaries of your project. For example, when does it start and end? Expect to keep your diagram as detailed as possible.
Step 3: Arrange Each Activity in Sequence
When you’re done noting all activities, expect to arrange its sequence from what happens first to last. That is where you learn how the flow of your procedure works. Poor arrangements eventually lead to drastic and wrong results. Also, you can use a draft first in arranging to be really sure of the outcome.
Step 4: Insert the Appropriate Symbols
Most importantly, add the appropriate symbols to your chart. But don’t simply use random symbols, use only what is needed for your process and each symbol should have relevant meaning. Expect to draw arrows showcasing the procedure’s flow. Lastly, ensure that the flow chart is simple and understandable before actually launching it.
FAQs
What are the functions of flow charts?
There are many uses of flow charts. And the top three functions of a flow chart are: (1) defining work processes, (2) evaluating the tasks’ timing, and (3) troubleshooting or providing solutions.
What are the types of flow charts?
Some of the most notable types of flow charts are:
- Process flow chart
- Swimlane flow chart
- Data flow diagram
- Workflow diagram
- EPC diagram
- SDL diagram
- Process flow diagram
- Process map
What are other elements expected in a flow chart?
You may need to include the following elements in your flow chart:
- Sequence of actions
- Materials and services that enter or leave the system
- Important decisions
- Parties involved
- Time or duration
- Process measurements
So the next time you have complicated business procedures, marketing strategies, political campaigns, programming projects, or anything hard to explain, simply present in the easiest way possible with flow charts. With a well-planned diagram or graphical data, people can easily understand what you are trying to work on visually. And the best part is you can create one anytime using sample flow charts.