8+ Sample Bubble Charts
FREE Bubble Chart s to Download
8+ Sample Bubble Charts
What is a Bubble Chart?
Different Types of Bubble Charts
When to Use Bubble Charts
Basic Components of a Bubble Chart
How to Create a Bubble Chart
FAQs
What is the purpose of a bubble chart?
What are the fundamental elements of a bubble chart?
What are some examples of a bubble chart?
What are the main characteristics of a good bubble chart?
What is a Bubble Chart?
Bubble diagrams or bubble charts are commonly used as project portfolio mapping tools when it comes to managing tasks and activities in a particular project or work. It provides a better focus on individual projects, showing them as standalone bubble sizes. Invented by a Swedish global health expert and data visionary named Hans Rosling, a bubble chart is a form of interactive motion chart which provides a clear visualization of wide-ranging aspects in connection to other elements, displaying the solid correlation between two or more variables.
According to a report,90% of projects require team participation as opposed to individual responsibility. So, creating an effective bubble chart will make it easier for your project team to organize all of your ideas visually. Plus, it is designed to help you stay on efficient project management while capturing your thoughts instantaneously.
Different Types of Bubble Charts
Chauncey Wilson wrote in Brainstorming and Beyond: A User-Centered Design Method that one of the most popular methods for ideation and appears to be a complex social process which requires knowledge of social psychology, motivation, and corporate culture is brainstorming. Brainstorming is important to focus on sheer quantity, defer judgment about the quality of ideas, and encourage new ideas. That’s why bubble charts are very crucial in brainstorming ideas while taking notes, collaborating and presenting more effectively. However, what are the different types of bubble charts that you need to make? Consider reading the details as follows:
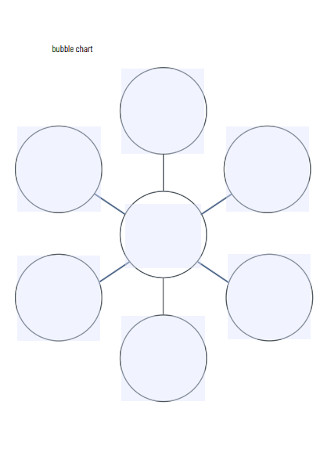
1. Simple Bubble Chart
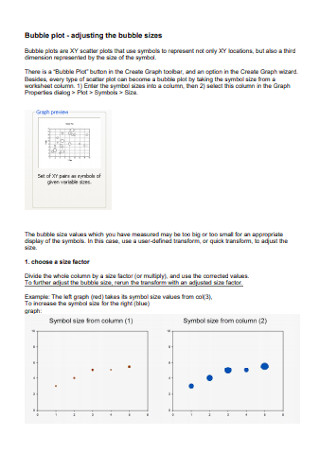
This is the most basic bubble chart type as it portrays only the first three numerical data columns in a specific table. For example, you are working on 3 variables using the horizontal axis, y-axis, and the size of the circle. Actually, there exist some possible differences when it comes to utilizing the values in generating the chart from the ones depicted in a table. Develop different variations of simple bubble charts if you are using the random number generator function in Excel.
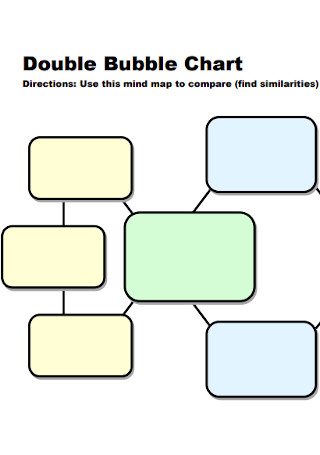
2. Double Bubble Chart
Do you need to make comparisons and contrasts on specific things such as artifacts, events, ideas, individuals, and places? If yes, then you will need to create a double bubble chart or map. A double bubble chart starts with two adjacent central bubbles in which the two ideas are indicated. Then, bubbles are incorporated between the two ideas or concepts to capture the common elements between them, while additional bubbles are included on the outer extremity of the two original ideas to capture varying elements. Educators, teachers, instructors, and teachers can utilize this bubble chart variation to assist their students in gaining clear insight about the idea of categories or certain kinds of descriptors.
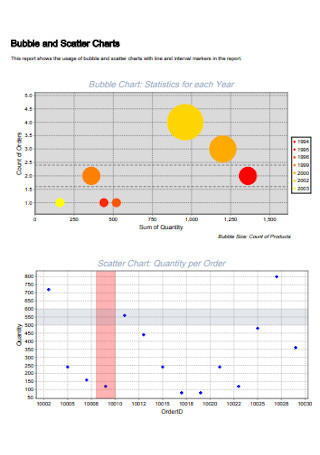
3. Bubble Scatter Chart
If your data contains three data series that each have a set of values, use a bubble scatter chart in order to present data points through bubbles with an additional dimension of the data illustrated in the size of the bubbles. Often used to display financial data, bubble charts are crucial to visually highlight specific values. To construct a bubble scatter chart, arrange your data in rows or columns on a worksheet and list the x values in the first row or column and list the corresponding y values and bubble size (z) in adjacent rows or columns.
4. Map Bubble Chart
Typically used on maps for geographical sciences, a map bubble chart is essential to represent a geographical location on the map. For instance, using a map bubble chart will guide you to plot a map so that you are able to identify specific places for your research work. To make sure that each location is properly recorded, the x and y axes will be plotted through the latitude and longitude of the places while the bubble size should tally according to the size of the graph on which it is being plotted.
When to Use Bubble Charts
To construct the right bubble chart which can provide your needs or offer potential solutions to specific issues and concerns, it is important for you to be familiar with the circumstances that are openly aligned with the usage or purpose of a certain document. Doing this will help you and your group members to share and collaborate extensively, allowing each one of you to record meaningful ideas, plan, and manage tasks, activities and meetings, and discuss the fundamental matters with the overall team. So, when to use bubble charts? Read this section to know more:
1. Keyword Density
What are people searching for online? How many people are searching for it? In what type of format do they want that information? The main job of keyword researchers is to conduct thorough research concerning popular search terms that the majority of the people type into their search engines like Google. This is useful when it comes to better understanding your target market and how they are searching for your content, products, or services. To determine the density of a certain keyword or hashtag, keyword researchers can use Word Graphs or other tools to create a yearly report of the most searched keywords. In particular, you can use bubble charts to easily determine the top searched term which occupies the largest space of the chart or map.
2. Search Engine Marketing
The biggest search engine market share in the world is Google. Starting 2020 with an average net market share of 70.38% on desktop, it continues to dominate in search engine use based on a report published by NetMarketShare. Also, an e-commerce activity report has shown that 81% of people search online for a product or service, 90% of them visit an online retail site or store, 67% used a shopping app on a mobile phone or a tablet, 74% purchased a product online, and 52% purchased a product online via a mobile phone. Creating a simple bubble chart is beneficial for search engine marketers to easily pinpoint the effect of a high Cost Per Click rate on the advertisement position, clicks, and website conversions, specifically if there are unique improvements in these factors. They can determine the size of the bubble by plotting the number of clicks on the x-axis, the cost per ad on the y-axis, and the growth in conversion rate.
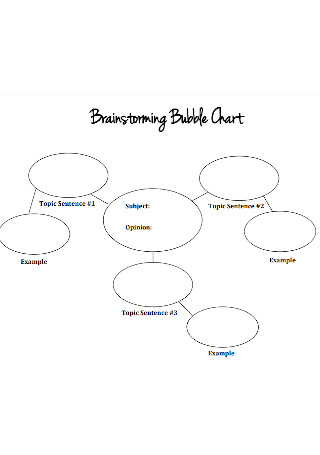
3. Brainstorming Process
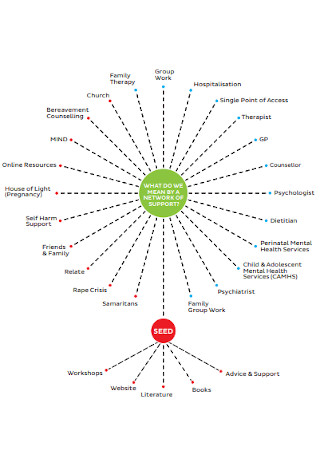
Easily record your ideas and concepts generated in a brainstorming process by using the freeform nature of the bubble chart. The bubble chart is useful for supporting the brainstorming process for both small and large projects. For example, the bubble in the center displays the outline of your overall project. It comprises lines from the center bubble leading to the first level categories. Then, the lines from each first level lead to the second level connected to that first level. Thus, use a bubble chart to develop your work breakdown structure (WBS) along your team members.
Basic Components of a Bubble Chart
In this section, you will learn how to construct a systematic bubble chart. However, a bubble chart contains different kinds of components. Take into consideration the following elements of a bubble chart format for you to create a simple and efficient document for proper management of your project:
How to Create a Bubble Chart
A report has shown that almost 70% of project professionals think that executives prioritize project management. Bubble charts are specifically advantageous in successful project management while visually demonstrating patterns in large data sets, trends, correlations, clusters or outliers. In order to make a simple bubble chart, we suggest that you follow the simple steps below on how to create a bubble chart while freely using one of our bubble chart samples in this article:
Step 1: Identify the Goals and Objectives
Before constructing a simple bubble chart, identify the specific goals and objectives that you need to consider while brainstorming or presenting your data visually. Get a notepad or paper and list down the primary elements that you need to focus and integrate in your bubble chart. Knowing where and what you will aim for serves as your guide throughout the development of your bubble chart and then towards effective project management.
Step 2: Build the Bubble Chart From Scratch
Then, now is the right time to build the bubble chart from scratch. Use all essential data that you need to illustrate so that you can add them in your project report. If you are struggling on how to build a simple bubble chart, look for some inspirations online. For example, the most beneficial examples of effective bubble charts are evident in Hans Rosling’s data stories 200 Countries in 200 Years in 4 Minutes and his TED talk “The Best Stats You’ve Ever Seen.” Be motivated on how he delivered his data as you emphasize the significant role you play especially in how your bubble chart is perceived by your audience.
Step 3: Search for a Simple Bubble Chart Template
Well, if you are still having some difficulties in creating the bubble chart for your visual data presentation, then we highly recommend that you search for a simple bubble chart template online. There are numerous bubble chart templates and samples around the Internet. That’s why we suggest that you search for our sample bubble charts in this article and download them right now! Use our sample bubble charts for organizing and monitoring your tasks, projects, and other factors involved in your work.
Step 4: Place the Main Points in the Chart Properly
Make sure that you place the main points or data in your bubble chart. Also, it is a good idea to label your axes, provide clear bubble chart titles, and annotate significant data points with luminescent context. If you need to use a data-dense chart type like a bubble chart, it is very integral that you organize the main points and data properly so that you are ready to clear away any possible misunderstandings or confusion that your audience might encounter while observing your presentation.
Step 5: Edit or Revise the Bubble Chart
After completing the overall structure of your bubble chart, look again and review your chart. Look for possible mistakes such as typographical errors, and confusing visual elements that you might insert in the chart. Then, edit or revise the bubble chart immediately before you include the chart in your project report or presentation.
FAQs
What is the purpose of a bubble chart?
The purpose of a bubble chart is to construct a clear visual representation of different relationships between three or more numeric variables. It can also be used in illustrating different ideas, concepts or topics for effective brainstorming, similar to a clustering map or mind-mapping in project management.
What are the fundamental elements of a bubble chart?
When constructing your bubble chart, you need to consider these fundamental elements such as creating a main idea or preparing your data, listing secondary or supplementary ideas or additional data, drawing a circular pattern or incorporating circles in the line graph, and connecting the elements with a line.
What are some examples of a bubble chart?
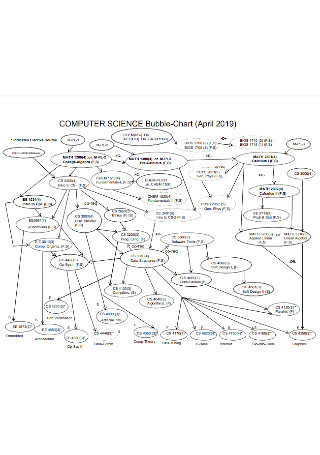
Some examples of a bubble chart are double bubble chart, simple bubble chart, brainstorming bubble chart, standard bubble chart, computer science bubble chart, bubble and scatter charts, formal bubble chart, and many others.
What are the main characteristics of a good bubble chart?
A good bubble chart should illustrate a clear and logical interpretation of the data. Encode the data by area in bubbles for visual comparison. Allow your audience to understand how to read your bubble chart by considering how they will think about your graph. Include some dynamic visuals to inform your viewers concerning the data indicated in your bubble chart.
Alfred Nobel said: “If I have a thousand ideas and only one turns out to be good, I am satisfied.” Creating a bubble chart is a significant method in gathering comprehensive information, and focusing on individual projects in the portfolio. Resembling XY charts, bubble charts are important data visualization and mind-mapping tools in facilitating effective project management. They plot different kinds of data of related data elements per observation. Additionally, these charts are mainly useful for coding the general impression of the third element in the three data or information, as well as in organizing and mapping out your ideas, concepts, and topics for your tasks, activities and projects. Thus, we recommend that you carefully follow the aforementioned tips and steps in this article so that you are able to craft a compelling and simple bubble chart. Plus, download our free bubble chart samples here today!